Wednesday, December 30, 2009

Measuring the Impact of the Stimulus Package with Economic Models

It's been nearly a year since the stimulus package of 2009 was passed. Unfortunately most attempts to answer the question “What was the size of the impact?” are still based on economic models in which the answer is built-in, and was built-in well before the stimulus. Frequently the same economic models that said, a year ago, the impact would be large are now trotted out to show that the impact is large. In other words these assessments are not based on the actual experience with the stimulus. I think this has confused public discourse.

An example is a November 21 news story in the New York Times with the headline “New Consensus Sees Stimulus Package as a Worthy Step.” Authors Jackie Calmes and Michael Cooper write that “the accumulation of hard data and real-life experience has allowed more dispassionate analysts to reach a consensus that the stimulus package, messy as it is, is working. The legislation, a variety of economists say, is helping an economy in free fall a year ago to grow again and shed fewer jobs than it otherwise would.”

As evidence the article includes three graphs, which are reproduced on the left of the chart below. Each of the three graphs on the left corresponds to a Keynesian model maintined by the group shown above the graph. All three graphs show that without the stimulus the recovery would be considerably weaker. The difference between the black line and the gray line is their estimated impact of the stimulus. But this difference was built-in to these models before the stimulus saw the light of day. So there are no new hard data or real life experiences here.

Now what about the so-called “consensus?” In fact, a number of other economic models predicted that the stimulus would not be very effective, and, using the same approach, those models now say that it is not very effective. To illustrate this I have added two other graphs on the right-hand side of the chart which did not appear in the New York Times article. The first one is based an a popular and well-regarded new Keynesian model estimated by Frank Smets, Director of Research at the European Central Bank, and his colleague Raf Wouters. Focus again on the difference between the black and the gray lines, which is what is predicted by that model, as shown in research by John Cogan, Volker Wieland, Tobias Cwik, and me. Note that the impact is very small. The second additional graph on the right is based on the research of Professor Robert Barro of Harvard University. As he explained last January, “when I attempted to estimate directly the multiplier associated with peacetime government purchases, I got a number insignificantly different from zero.” So according to that research, the difference between the black and the gray line should be about zero, which is what that graph shows. So there is no consensus.

Menzie Chen has a post on Econbrowser which mentioned the three graphs in the original New York Times article as an illustration of his excellent analysis of the use of counterfactuals (the gray lines in the graphs). The additional two graphs illustrate how important it is to go beyond a few models and establish robustness in policy analysis. Moreover, in my view, the models have had their say. It is now time to look at the direct impacts using hard data and real life experiences.


Saturday, December 26, 2009

Implications of the Crisis for Introductory Economics

People ask how I think introductory economics teaching should change as a result of the financial crisis. It’s an important question. At the upcoming American Economic Association Annual Meetings, my colleague Bob Hall, next AEA President and Program Director, has included on panel on the topic.

Clearly we need to include more on financial markets, but based on my experience teaching in the two-term introductory course at Stanford, I think the single most important change would be to stop splitting microeconomics and macroeconomics into two separate terms. The split has been common in economics teaching since the first edition of Paul Samuelson’s textbook, which put macro first. Many courses now have micro in the first term and then macro in the second.

But regardless of the order now used, I think a reform that integrates micro and macro throughout is worth considering. There were arguments for doing this before the crisis, including the fact that in research and graduate teaching the tools of micro have now been integrated into macro.

The financial crisis clinches the case for full integration in my view. The crisis is the biggest economic event in decades and it can only be understood with a mix of micro and macro. To understand the crisis one must know about supply and demand for housing (micro), interest rates that may have been too low for too long (macro), moral hazard (micro), a stimulus package (macro) aimed at such things as health care (micro), a new type of monetary policy (macro) that focuses on specific sectors (micro), debates about the size of the multiplier (macro), excessive risk taking (micro), a great recession (macro), and so on. It you look at the 22 items that the Financial Crisis Inquiry Commission has been charged by the Congress to examine, you’ll see that it is a mix of micro and macro. Defining the first term as micro and the second term as macro, or visa versa, is no longer the best way to allocate topics.

Moreover, the introductory course can be integrated in a way that makes economics more interesting for students. This year at Stanford we have been experimenting with such an integration in our principles course, and so far it seems to be working well. (The course, Economics 1, is taught this year by me (1A), Marcelo Clerici-Arias (1B), Gavin Wright (1A), and Michael Boskin (1B)). In 1A, which has been mainly micro until this year, I shuffled in macro concepts at various places. When I talk about aggregate investment demand I said it came right out of the micro demand for capital. Similarly aggregate employment and unemployment can be explained in the context of micro labor supply and demand. The proof that aggregate production (GDP) equals aggregate income can be stated at the time one defines profits as equal to revenues minus cost of labor and capital. In the second term we then go into such topics inter-temporal consumption which is at the heart of both micro and macro and time inconsistency, which has both macro and micro aspects. The demand for money as a function of the interest rate is easily explained with the opportunity cost concept.

Such curriculum changes incur some transition costs. For example, the economics textbooks are not quite ready for this. We are using my textbook with Akila Weerapana this year and it has the usual micro/macro split. But it is not too hard to mix and match pages, and many publishers custom design texts.

This approach also has the advantage that the traditional split does not have. It lends itself to a system where students can take a one term overview course in 1A (mainly non-econ majors) and not have to miss all of micro or all of macro. I hope that others can benefit from this approach and have constructive comments about it.

Tuesday, December 22, 2009

Financial Crisis Inquiry Commission Gets Started

Today the Financial Crisis Inquiry Commission announced its first public hearing, which will start at 9 am on January 13 and continue through January 14. The topic: Causes and Current State of the Financial Crisis.

That public hearings are about to start is excellent news. Without such an investigation, followed by a clear explanation to the American people of what went wrong, the Congress is unlikely to enact financial reforms that actually fix the problem. To repeat a phrase from the Chairman of the Brady Commission on the 1987 crash (their report took only 4 months to complete), "You cannot fix what you cannot explain."

Though not part of its Congressional mandate, I recommend that the FCIC follow the approach of the Brady Commission and the 911 Commission and make some recommendatiions. It could then even issue a report card on how the recommendations are implemented. Such a Report Card was issued by the 911 Commission and it proved quite useful.

Sunday, December 20, 2009

Estimating the Impact of the Fed's Mortgage Portfolio

Some of the big questions looming about the Fed’s exit strategy are if, when, and at what pace the Fed should draw down its huge portfolio of mortgage backed securities (MBS). At its meeting last week the Federal Open Market Committee announced that it is continuing its MBS purchases at a “gradually slowing pace,” but that will still leave $1,250 billion in MBS on its balance sheet at the end of the first quarter. Another, more long-term, question is whether such price-keeping operations—a term used by Peter Fisher who once ran the trading desk at the New York Fed—should be a regular part of monetary policy in the future. Brian Sack, who now runs the trading desk, concludes in a recent speech that they should be.

The answer to these important questions requires on an empirical assessment of the impact of the MBS purchase program. Unfortunately, publicly available assessments are sorely lacking. For this reason, Johannes Stroebel and I undertook an econometric study of the impact; the study is part of a larger research project by us and our colleagues on central bank exit strategies.

Such an assessment requires that one carefully consider other influences on rates on mortgage backed securities. We focused on two obvious ones: prepayment risk and default risk. If we control for prepayment risk using the swap option-adjusted spread, which is regularly used by MBS traders and investors, and if we control for default risk using spreads on senior or subordinated agency debt, we find that that the program has not had an economically or statistically significant effect on mortgage spreads. If we use other measures to control for prepayment and default risk we can see statistically significant effects, but they are small. Even in these cases it was the announcement or the existence of the program, rather than the size of the portfolio that mattered for spreads. We find that there is no statistically or economically significant effect of the size of the portfolio, a finding which we show is quite robust. If our estimates hold up to scrutiny, they raise doubts about such price-keeping operations and suggest that the Fed could gradually reduce the size of its portfolio without a significant impact on the mortgage market.


The graph illustrates our findings. It shows the swap option adjusted spread (with its prepayment risk adjustment) in red and the predictions of that spread using the agency debt spread (a measure of risk) in blue. The residual between these two, shown in green at the bottom of the graph, indicates that there is little left for the Fed's MBS portfolio to explain. Details and other cases are in the paper.

Sunday, December 13, 2009

David Wessel’s Doubts About “Whatever It Takes”

Big Think is conducting a series of video interviews with economists, market participants, journalists, policymakers and others on the financial crisis to try to answer the pressing question of “what went wrong.” This is an excellent idea. As former Treasury Secretary Nicholas Brady said last week “you can’t fix what you can’t explain.” The Financial Crisis Inquiry Commission should take note.

The interview with David Wessel of the Wall Street Journal was the first in the series. Among many good questions put to David, one of the most interesting was “Did Bernanke’s mantra of ‘whatever it takes’ lead us astray?” In David’s 575-word answer, he offers 5 positive words that it “got us through this crisis,” but gives no explanation for that and instead goes on for the remaining 570 words talking about the problems the approach has caused and is causing, including that “it can justify almost anything.” Among other problems he mentions the Bernanke-Paulson-Geithner “mistake” of “wasting the time after Bear Stearns” and “not coming up with a more articulated game plan for what they would do if they had to cope with a collapse with another financial institution.” In effect what you see in the video is a cogent argument that the approach may have seriously worsened the crisis even if it eventually got us through it. So it seems like the answer to the question is: yes, it led us astray. And since the problem has not been addressed--as David points out in the last few sentences—it is likely to continue to lead us astray.

Saturday, December 12, 2009

A Perfect Storm or It's Not My Fault?

This past week we held a conference on Ending Government Bailouts As We Know Them. One of the biggest surprises coming out of the conference was the growing recognition that the bankruptcy process--perhaps amended with a new Chapter 11F--is quite viable for financial institutions, and that a new FDIC-like resolution process that goes beyond banks may not be neeeded. In addition, all three keynote speakers, former Treasury Secretaries George Shultz and Nick Brady as well as former Fed Chairman Paul Volcker spoke in favor of constraining the activities of banks that have access to Fed loans and guaranteed deposits. The biggest concensus item, however, was that Congress and the Administration should wait for a report explaining the causes of the crisis before moving ahead on reform legislation. And Brady shot down a common explanation very effectively. "The least convincing explanation [of the crisis] is one floating around the industry that attributes the events to 'a perfect storm.'—i.e., it’s not my fault."

Sin Rumbo

The just-released Spanish translation of my book, Getting Off Track, is titled Sin Rumbo, which translates back to English as “without direction” or “aimlessly." Although the Spanish title has a somewhat different connotation than the English, it is actually an excellent title because it portrays another problem with government policy during the financial crisis, namely that there is no coherent strategy—no direction—for dealing with the crisis once it flared up in August 2007. The Spanish translation of the subtitle is more straightforward: De cómo las acciones e intervenciones públicas causaron, prolongaron y empeoraron la crisis financiera.

Sunday, December 6, 2009

Monetary Policy and the Wisdom of Wayne Gretzky

I’m always trying to find good ways to teach beginning economics students about monetary policy. For years I compared it to flying a fighter jet where you have to anticipate the actions of the other pilots, and if you get it wrong you crash and burn in a great depression or a great inflation. I liked to show the scene from the movie Top Gun where, in a classroom scene after a flight, instructor Kelly McGillis (Charlie) chastises fighter pilot Tom Cruise (Maverick) for a near crash and burn because of his risky behavior. I stopped showing that scene because the next scene is quite a bit more intimate, not really appropriate for an introductory economics class, and if you do not stop the DVD just in time the students get completely distracted from the subject of monetary policy. Once while I was lecturing at West Point the DVD didn't stop and the movie rolled on past the classroom scene to the next scene to a roar of laughter from hundreds of Army cadets in the lecture hall watching the big screen behind me.

So I was pleased that Philadelphia Fed President Charles Plosser, in a speech last Tuesday in Rochester, came up with an even better analogy: hockey. He tells the story of how “Hockey great Wayne Gretzky was once asked about his success on the ice. He responded by saying, ‘I skate to where the puck is going to be, not to where it has been.’ He didn’t chase the puck. Instead, Gretzky wanted his hockey stick to be where the puck would be going next. He scored many goals with that strategy, and I believe monetary policymakers can better achieve their goals, too, if they follow the Gretzky strategy.”

Wednesday, November 25, 2009

Be Thankful But Study What Happened

With the consumption data released today--the day before Thanksgiving--we are reminded to give thanks that retail sales are at least growing not declining sharply as they were a year ago. But what was it really like out there day-by-day in the shopping centers a year ago? How rapidly were sales declining? And what did it have to do with what was happening on Wall Street? To answer these questions, I examined daily retail sales from Target stores in the weeks before Thanksgivng last year. The data were provided to me courtesy of the Target Corporation.

Daily sales are hard to analyze because they jump around so much and because there are stong seasonals and huge within-week variations as you can see in the first chart showing sales at Target stores around the country. But after adjusting the data for these factors one can see more clearly what was happening as shown in the adjusted data in the second chart. The details of how you get from the first chart to the second chart are in my note Analysis of Daily Sales Data during the Financial Panic of 2008. As shown in the second chart, daily sales had been declining in the summer of 2008 compared to 2007, as the recession began in late 2007. But there was a noticeable acceleration in the decline from September to November 2008. The acceleration appeared to start before the Lehman bankruptcy on September 15, and there was no noticeable effect at the time of that bankruptcy or shortly thereafter. It was not until a week later that sales really began their precipitous decline in panic-like fashion that paralleled the panic in the financial markets. This was during the chaotic period that various government responses were being proposed, debated, criticized, and implemented, suggesting that these responses were themselves a factor. However, it is difficult to find a negative impact on sales of single events or dates during the panic. Rather there appears to have been a more cumulative, yet still very sharp, negative impact

Tuesday, November 24, 2009

Economic Freedom and Rose Friedman

We are hearing a lot these days about the disadvantages of free markets and the need for a greatly expanded role of government in the economy. Last month I spoke at a wonderful memorial for Rose Friedman. We celebrated among other things about Rose's life, her strong advocacy, along with her husband Milton Friedman, of free markets, starting in the 1940s and 1950s, another time of talk about the disdvangates of free markts. The memorial took place at the Hoover Institution on the Stanford campus. George Shultz, David Friedman, Bob Chitester, and others spoke. There was a lot of talk about the need to reenter the fray. I spoke about how Rose was an inspiration for anyone who wishes to do so.

Sunday, November 22, 2009

New Evidence of Government Induced Risk

A year ago I wrote Getting Off Track one of the first books on the financial crisis. I argued, based on data available at the time, that government actions caused, prolonged and worsened the crisis. After a year of debate, this early assessment is holding up well. Indeed it is being reinforced by new evidence.

Consider, for example, the government actions associated with the takeover of Fannie and Freddie in 2008. Of course, Fannie and Freddie were a big part of the reason for the explosion in mortgage debt including risky subprime mortgages, but I want to focus now on the impact of government actions relating to these institutions during the period leading up to the panic in 2008.

A good way to assess this impact on risks is to look at the spread between interest rates on subordinated debt and senior debt at Fannie or Freddie. When investor concerns about risks at the institutions increase, the interest rate spread between subordinated and senior debt rises. So what caused the movements in these spreads in 2008?

The three charts show the spread between the interest rate on Fannie Mae subordinated debt and Fannie Mae senior debt over three different periods. The yellow line with the green shading in the lower panel of each chart is the interest rate spread of sub debt over senior debt. In the top panel (harder to read) the orange line is the rate on subordinated debt and the white line is the rate on senior debt. The first chart focuses on the period from June 2004 to February 2008. The spread was fairly stable fluctuating in a rather narrow range around 20 basis points over this period.

The second chart covers the period from March 2008 through June 2008. Observe that the spread jumped to around 80 basis points after the Bear Stearns intervention. Unlike many other risk spreads it did not come back down after Bear Stearns.

The third chart focuses on the period from July 2008 through September 2008. There are two big upward jumps during this period. The first was on July 11. What was the big event that day? It was a leaked news story about a possible government action, a takeover of the two institutions. In particular the New York Times ran a front page story with the headline "U.S. Weighs Takeover of Two Mortgage Giants"

The other big jump up was on Monday August 18th. Again the reason was a news story about another government action. The previous Friday the Washington Post reported that the Treasury hired Morgan Stanley to assess the vulnerability of Fannie and Freddie, a strong indicator that the government was looking for outside justification to take over the institutions. It is important to note also that certain other events, which could have moved the spread up, did not move it up. When Freddie and Fannie released their second quarter earnings in August, there was little to no reaction in the spread.

So the major movements are clearly linked to government policy decisions and news stories about them. This timing does not prove that the government actions were responsible, but at the least it raises questions about why rumors of possible government actions were leaked to the news media.

The questions are important because some government officials have indicated that these jumps in the subortinated debt spread were part of the evidence to justify the take over the institutions at this time. But the evidence shows that the government itself was increasing the spreads.

Friday, November 20, 2009

Monetary Policy Week

This week was monetary policy week in Economics 1 at Stanford. It was also monetary policy week in Washington: the House Financial Services Committee surprisingly voted 43-26 for Ron Paul's controversial bill to audit the Fed; the TARP inspector general found that the Fed's AIG bailout was unnecessarily generous to creditors; and people continued to debate how long the Fed could hold the interest rate at zero without threatening the dollar.


To discuss the interest rate decision in my lectures, I made use of the Taylor Rule, a guideline for the Fed and other central banks to use in setting interest rates. To start I showed the students how to derive the rule from economic theory. Actually, the students derived the rule on their own--with the help of a little Socratic questioning--even choosing the signs of the coefficients and the target inflation rate (2 percent) correctly. I was happy to welcome the NewsHour's Paul Solman and his camera crew who came to film part of this lecture. Here's my paper on what others would later call the Taylor Rule

The Taylor Rule says the interest rate should equal one-and-a-half times the inflation rate plus one-half times the GDP gap plus 1. Rounding off to the nearest percent, inflation is running around 2 percent and the GDP gap around -8 percent, so the rule says the interest rate should be near 0, (1.5 x 2 + .5 x (-8) + 1 = 0) which is about where the Fed is now. As the economy recovers and real GDP increases, the Fed should raise rates. If inflation picks up too, it will have to do so more rapidly.

Several columnists and bloggers also used the Taylor Rule this week, including Gene Epstein of Barron’s in “Better Baking for the Bank: The Right Recipe for Rates.” The recommended interest rate setting can vary a bit because of different estimates of the inflation rate and the GDP gap (the percentage difference between real GDP and potential GDP). Epstein also finds the interest rate to be close to zero, but slightly higher at 0.6 percent.

But sometimes you read really wild things about what the interest rate should be. Paul Krugman’s Monday piece about the Taylor Rule is an example. He says he likes to use an estimate of the Taylor Rule. But the estimate is much different from the Taylor Rule, so he gets a much different interest rate setting of -7 percent! This implies that we are unlikely to see a positive interest rate for many years, which would be dangerous for the stability of dollar let alone the stability of the U.S. and world economy. I explained the problems with using such estimates in a Bloomberg oped several months ago. Estimates can perpetuate past mistkes. In the current environment they could lead to a repeat of the same mistakes that led to this deep recession. Michael McKee, in another Bloomberg opinion piece , suggested a line for me from Woody Allen's Annie Hall, where Marshall McLuhan makes an appearance and tells an academic pontificating about McLuhan: “you know nothing of my work!”

Friday, November 13, 2009

The Road Ahead for the Fed

Stories this week in the Wall Street Journal, the New York Times and the Washington Post focus on how Senator Chris Dodd's new financial reform bill threatens the independence of the Federal Reserve. And Larry Kudlow took it up on his CNBC program. Loss of Federal Reserve independence is a serious problem, especially at this time of rapidly increasing Federal debt and a greatly expanded Federal Reserve balance sheet. But an important issue not touched on in these stories is that Fed actions during the crisis have themselves raised questions about its independence. After reviewing these actions in the new book The Road Ahead for the Fed, former Secretary of Treasury George Shultz writes:

"Observing this process, the question comes forcefully at you: Has the Accord gone down the drain? And remember how difficult it was for the Fed to disentangle itself from the Treasury in the post-World War II period."

Secretary Shultz is referring to the 1951 Accord where the Federal Reserve regained its independence following the World War II peg of Treasury borrowing rates. So even without the Dodd bill the Fed has a lot of work to do to disentangle itself. For a broader summary see Tom Simpson's recent review of this book which came out of a conference hosted at the Hoover Institution at Stanford Univeristy by John Ciorciari and me last March.

Friday, November 6, 2009

Jobs Saved: PR or Fact?

While the unemployment rate continues to rise--to 10.2 percent in October--the debate over the "jobs saved" concept also continues, most recently on last Sunday's Meet the Press with host David Gregory asking Treasury Secretary Timothy Geithner whether the concept is PR or Fact. Gregory first quotes Allan Meltzer saying “One can search economic textbooks forever without finding a concept called 'jobs saved.' It doesn’t exist for good reason: how can anyone know that his or her job has been saved?” Gregory then pops the question to Secretary Geithner. Watch this short video clip for his answer, and then search your textbook as Professor Meltzer suggests.

Tuesday, November 3, 2009

Government Failure versus Market Failure

My Forbes magazine column this week reviews the latest empirical evidence on why government actions and interventions--government failure rather than market failure--should be at the top of the list of what went wrong in the recent financial crisis. Some continue to be surprised by my finding. While I focus on macroeconomic policy, mainly monetary policy and fiscal policy, my finding that government failure rather than market failure rises to the top of the list is not at all unsual in the broader context of empirical policy evaluation research.

Cliff Winston of the Brookings Institution carefully reviews three decades of empirical research on a wide range of microeconomic policy studies in his important book Government Failure versus Market Failure. He comes to the same basic conclusion; as he puts it "thirty years of empirical evidence... suggests that the welfare cost of government failure may be considerably greater than that of market failure."

It is interesting that he focuses on research done outside of government because, again as he puts it, "studies conducted by the government,...can be biased, inconsistent, and technically flawed." So perhaps it is not surprising that so few government agencies or officials are pointing to government failure as the main problem in the recent financial crisis.

Sunday, November 1, 2009

Greg Mankiw and Homework on Marginal Tax Rates

In an op-ed in today's New York Times Harvard's Greg Mankiw gives a good example of how government transfer programs increase marginal tax rates. He uses the same example assigned to Stanford's introductory students in their homework last week--the Senate Finance Committee's health care plan. Both Mankiw's op-ed and the homework consider the marginal tax rate increase implicit in the plan. Students in introductory economics courses around the country are hearing a lot about the health care debate, which is what makes Greg's column a good reading assignment.

Mankiw considers a family whose income rises from $54,000 to $66,000 and who loses $2,800 in government-provided health care benefits by earning $12,000 more income. The marginal tax rate is the lost benefit divided by the increase in income, which is a high 23 percent (2800 divided by 12000). The high marginal tax rate is a disincentive to work more.

The homework example has an even higher marginal tax rate and a larger disincentive. It consides a poorer familiy whose income rises from $24,000 to $48,000 and thus loses $7,300 in government-provided health care benefits according to the Senate plan. The marginal tax rate is 30 percent (7400 divided by 24000).

So the increase in marginal tax rates in the Senate plan is higher for poorer families.

Friday, October 30, 2009

National Accounts Show Stimulus Did Not Fuel GDP Growth

Along with the news that real GDP growth improved from -0.7 percent in the second quarter to 3.5 percent in the third quarter, the Bureau of Economic Analysis (BEA) released detailed National Income and Product Account tables yesterday, which received little comment in the press today. These tables make it very clear that the $787 billion stimulus package had virtually nothing to do with the improvement. Of the 4.2 percent improvement, more than half (2.36 percentage points) was due to firms cutting inventories at a less rapid pace, which has nothing to do with the stimulus. (For the details look at BEA’s Table 2 which shows that the contribution of inventory investment increased from -1.42 to .94 which equals 2.36.)

What about the other components of GDP? In particular what about government spending, which was supposed to be a big part of this stimulus? Government spending was a negative factor, subtracting 0.9 percentage points from the change in GDP growth.

Automobiles and parts contributed 1.15 percent for the quarterly improvement, but as today’s release of monthly data shows that was an unsustainable temporary blip: up in August and down in September due to cash for clunckers. Here is how BEA put it today: “Purchases of motor vehicles and parts accounted for most of the decrease [in real consumption] in September and for most of the increase in August, reflecting the impact of the federal CARS program (popularly called “cash for clunkers”). The program, which provided a credit for customers who purchased a qualifying new, more fuel efficient auto or light truck, ended on August 24, 2009.” And the latest consumption and income data in today's release reveal no noticeable impact of the temporary tax rebates and one time payments on consumption as John Cogan, Volker Wieland and I had earlier shown.

Tuesday, October 27, 2009

Ending Government Bailouts As We Know Them

Fears of potential damage from the failure of a large financial institution has created a bailout mentality in which the U.S. government has committed many billions of dollars, intervened in the operations of scores of private firms, and caused excessive risk-taking. A new policy is needed. Two proposals were considered in testimony at the House Judiciary Committee a few days ago. Michael Barr of the U.S. Treasury and David Moss of Harvard supported a proposal to create an FDIC-like resolution regime for any financial firm viewed as too big or complex to fail. Testimony by David Skeel of Penn and me criticized that approach as institutionalizing the bailout process seen during the crisis and supported alternatives in which the failing financial firm would go through a bankruptcy process designed to deal with financial firms. Look forward to more analysis of this important topic in the coming weeks.

Saturday, October 24, 2009

The Great YouTube Economics Contest

Sponsored by
The Federal Reserve Bank of St. Louis

And the Answer Is…Productivity

I teach Economics 1 with an “audience response system” similar to the ones you see on TV game shows. Think of the “Lifeline” on “Who Wants to be a Millionaire?” Each student in the lecture has a little hand-held transmitter. They press the keys on the transmitter to give their opinions on issues or answers to questions. Their answers come directly into my laptop computer and are immediately projected in a bar chart on the screen, creating an opportunity for discussion.

The question on the right generated a good discussion this week. I asked students to respond A through E at the start of the lecture, which was about labor productivity and wages. Later in the lecture I then presented and explained the chart below which shows that the best answer is B. Productivity growth is highly correlated with compensation growth over time as predicted by basic economic theory and leaves relatively little for A, C, D, or E to explain. But before seeing the graph many guess another answer, and I suspect most people are surprised that there is so little to explain after you take productivity into account.
In the chart, labor productivity (output per hour of work) and compensation (wages plus fringe benefits per hour of work) pertain to the nonfarm business sector in the United States. Compensation is adjusted for inflation by dividing by the price of nonfarm business output which corresponds with the output measure. In the past few years the consumer price index (CPI) has grown faster than the price index for nonfarm business output. So if you adjust compensation by the CPI rather than the price index for nonfarm business as in the chart, compensation per hour deviates slightly below the productivity line in recent years, but the basic story over the long haul is the similar.

Friday, October 23, 2009

Despite claims, data continue to show small impact of stimulus

Debate about the impact of the $787 billion stimulus continued this week. “Thanks largely to the Recovery Act,” Larry Summers argued, “we have walked a substantial distance back from the economic abyss and are on the path toward economic recovery.” Yet the latest data from the Department of Commerce continue to show that only an insubstantial part of this distance was due to the stimulus. The table shows the latest Department of Commerce estimates of the contributions of consumption, investment, net exports, and government spending to the improvement in GDP growth from the first to second quarter. Growth improved by 5.7 percent (from -6.4 percent to -0.7 percent). Private investment was by far the major source. Government spending contributed 1.9 percentage points, but more than half of that was defense spending which was not part of the stimulus. The table is an update of information reported in my Wall Street Journal article of last month with John Cogan and Volker Wieland. This one-page brief provides more details and also shows that direct spending from the stimulus contributed only 0.3 percent of 5.7 percent. We will learn more when the Department of Commerce releases data from the third quarter next week, but so far their data are very clear that the stimulus is having a negligible impact.

Friday, October 16, 2009

Speaking of Monetary Policy Rules

This was another week with a lot of commentary on the Taylor Rule, and I am grateful to Jon Hilsenrath of the Wall Street Journal for suggesting an interview with me on the subject and posting it on Wednesday. He raises many good questions.

A few days earlier Paul Krugman wrote a piece using an estimated version of the Taylor rule rather than the actual normative rule I proposed back in 1992. He was trying to make the case that the Fed should keep the interest rate at zero for two more years. As explained in this Bloomberg News op-ed piece, I disagree with using estimated policy rules this way because it causes past mistakes to be repeated.

On Tuesday David Altig used another estimated policy rule. He was writing about the causes of the financial crisis. He used an estimated policy rule to argue that the very low interest rate set by the Fed in 2002-2005 was not an inappropriate deviation from a policy that worked well in the 1980s and 1990s, contrary to what I and others have argued. But his estimated version of the Taylor Rule uses the most recent federal funds rate (no matter what it is) to determine what the current federal funds rate should be at each Fed meeting. Such an approach is circular, assuming in essence that the Fed follows itself, which makes it difficult evaluate when policy is good and when it is not. Yesterday David Beckworth wrote an article explaining clearly the problem with such an approach.

Thursday, October 15, 2009

Golden Balls and Duopoly: Shocking or Predictable?

Want to see an amazing illustration of how the game theory model of duopoly works? Watch this video from the British TV show Golden Balls. In the classic case of duopoly, two firms (call them Sarah and Steve) produce and sell a good in a single market. Each firm has the choice of charging a high price or a low price. A simple case is shown in the payoff table at the right. If Sarah and Steve cooperate and both charge a high price they split the higher profits. Each gets 50. But if Sarah undercuts Steve and charges a lower price, she will steal all the customers from Steve. She gets 100 and he gets 0 profits. Or Steve might undercut Sarah, and then he gets 100 and she gets 0. If they both charge a lower price, they both lose out. Of course consumers benefit by the low price which is why this is an important economic issue. The game of Golden Balls has the exact same structure. I showed this video in lectures today. It was a hit.

Monday, October 12, 2009

A Teachable Moment

The awarding of the Nobel Prize in economics is always a teachable moment. This year’s award is no exception. It recognizes research on “economic governance” and goes to Elinor Ostrom for her work on “the commons” and to Oliver Williamson for his work on “the boundaries of the firm.” Both Ostrom and Williamson focus on the interactions between people outside the usual market mechanisms, an important topic to teach in the first lecture or the first chapter of Principles of Economics. The Nobel Prize Committee web page provides an excellent summary of their contributions with many examples. Ronald Coase originated research on this subject and won the Nobel Price for it back in 1991. I think it is important to note how Ostrom and Williamson build on Coase’s work in different ways. What do they teach us?

Williamson’s research teaches us to recognize when transactions will take place within a firm and when they will take place in markets. He significantly extended Coase’s insights on reducing transactions costs by delineating the advantages of such within-firm interactions when mutual dependence between people is high. The predictions of his theory are testable and have been confirmed in many empirical studies.

Ostrom's research teaches us that “market failure” due to externalities or public goods of the kinds illustrated in Garrett Hardin’s famous "tragedy of the commons" example can be resolved by genuinely engaged individuals working together, and that government intervention may therefore not be needed to solve such market failures. Indeed she finds that individual arrangements frequently achieve better results than government intervention. In this way she too builds on the work of Coase.

Sunday, October 11, 2009

Fuori Strada

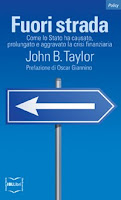
This cover design of Fuori Strada: Como lo Stato ha causato, prolungato e aggravato la crisi finanziaria, the just released Italian edition of Getting Off Track, says it all, and the economic policy lessons are the same in any language: Get back on the road. Get back on track.

To Prevent Bubbles, Don’t Create Them

In their widely-cited Wall Street Journal column last week, Ian Bremmer and Nuriel Roubini argue that to prevent asset price bubbles in the future the Fed should focus on “properly calculating asset prices and the risk of asset bubbles according to the Taylor rule, an important guideline central banks use to set interest rates.” Central bankers such as Bill Dudley and Kevin Warsh of the Fed and Mark Carney of the Bank of Canada also propose that asset prices be factored in to interest rate decision criteria such as the Taylor rule. Adding asset prices to the Taylor rule would be a big change because the Taylor does not now incorporate asset prices, and much research, including Ben Bernanke's research ten years ago, shows it shouldn’t.

The rationale for the proposed change is that the sharp run up in housing prices, which lead to the financial crisis, was caused by interest rates being too low for too long. If central banks had taken account of housing price inflation they would have raised interest rates earlier—so the story goes. They would have stopped the bubble before it got so big, or burst it when the burst would not have caused so much damage.

I agree that the Fed held interest rates too low for too long, and I provided evidence of this at the summer 2007 Jackson Hole conference. But the problem was not that the Fed ignored the housing boom. The problem was that it caused it. Look at the nearby chart from The Economist. It shows the Taylor rule without any asset prices and the actual interest rate. Clearly interest rates were too low. By deviating from the rule and keeping interest rates too low, the Fed caused the acceleration in housing prices. If the Fed had simply conducted monetary policy as it had in the 1980s and 1990s, we would likely not have had the housing boom.

Even putting aside the problems of identifing asset bubbles, pointed out by Donald Luskin, or the danger of creating collateral damage by doing so, adding asset prices to the equation would not address the real problem. Saying that adding asset prices to the central bank’s rule would prevent bubbles is like saying that requiring hikers in the forest to carry cell phones to call the fire department will prevent the damage from forest fires they start. By the time they call and the fire trucks arrive, the heat and flames will have caused tremendous damage. Far better to prevent hikers from starting fires in the first place. Far better for central bankers not to create bubbles in the first place.

Friday, October 9, 2009

Taking Stock at the Fed

Yesterday and today, three economists (Andrew Levin, Chris Erceg and Mike Kiley) who work on the staff of the Federal Reserve Board graciously hosted a big gathering of monetary economists from around the world. The get together was held on the top floor of Fed’s office building in Washington DC overlooking the Mall. Its purpose was to take stock of key research developments in monetary theory and policy over the past few years. For example, John Williams of the San Francisco Fed and I flew in from California and reviewed recent research on monetary policy rules. All the papers will eventually be published in a new Handbook of Monetary Economics.

The meeting demonstrated how completely wrong Paul Krugman is about recent developments in economics, at least as he portrayed the subject in the New York Times Magazine last month. This was not an all efficient markets meeting. The talk from start to finish was about the market imperfections, price rigidities, deadweight losses due to market power, and imperfect information, which all occur in monetary economics. If anything there was too much focus on market distortions. Overall I saw tremendous progress documented at the meeting. The presentation by my Stanford colleague Pete Klenow and his coauthor Ben Malin, for example, reviewed the impressive volume of empirical research on firm price setting decisions using new BLS data sets. Their discussant Marty Eichenbaum pointed to even more of this kind of research, which solidifies and bolsters the type of monetary theory that has been developed in recent years.

But if there has been so much progress in monetary economics, then why did we have the financial crisis? I argued that it was the policy, not the economics, which got off track. When the policy implications of the research were followed by policy makers, we had good economic performance, as in the period called the Great Moderation. When policy got off track, the Great Moderation ended in the financial crisis and Great Recession. I am hoping that policy will get on track again and we will have Great Moderation II.

Tuesday, October 6, 2009

The Price System in Action

Want to understand what really goes on behind the scenes of the supply and demand model? Read this wonderful clear essay by Russell Roberts. It explains how prices provide information, coordinate, and motivate decisions with many more details than in the summaries of Adam Smith and Milton Friedman in my October 3 post.

Saturday, October 3, 2009

Two Masters Speak on Power of Markets

The "free market" lectures--we had them last week at Stanford--are my favorites in Economics One. I wear this Adam Smith tie, give a short summary of Smith's writings, read his story of the woolen coat from the pages of his Wealth of the Nations, and then we all watch Milton Friedman's two-minute pencil lecture on YouTube, where you can see that he also wore an Adam Smith tie. We then dive into the technical explanation of how with competitive markets the price system leads to an efficient allocation of resourses and production. I only wish Smith were on YouTube. Next week we consider monopoly, which is not a story of efficiency.

Friday, October 2, 2009

A Beautiful Model, A Clear Prediction

The supply and demand model, which students learn in the first week of Economics One, is a beautiful, powerful tool for investigating real world issues like the minimun wage, the subject of tomorrow's Wall Street Journal editorial. The model's prediction is chrystal clear as this little diagram from my lectures shows: a minimum wage causes unemployment, especialy for young unskilled people, just as the Journal argues. Of course the size of the impact depends on the steepness or elasticity of labor demand. So empirical research by economists like David Neumark and Bill Wascher cited in the Journal is essential. Their research is described in this box from my Principles of Economcs book. The research shows the impact to be quite significant. But as is so often the case in economics, not all economists agree, so the box also describes some contrary findings by David Card and Alan Krueger. I side with Neumark and Wascher in this debate, but you can read the editorial, look at the diagram, read the box, and draw your own conclusions.

Monday, September 28, 2009

The Best Economics 1 Lecturer Ever

I decided to invite a young guest lecturer to my Economics 1 class to help students think about the alarming federal debt charts and the exploding debt burden on future generations. She stole the show. Here is a video of some excerpts. I play a supporting role.

Saturday, September 26, 2009

The Real Anniversary

Two weekends ago the big news was the one-year anniversary of the Lehman Brothers bankruptcy and the ensuing panic. But when you look at the data, the real one-year anniversary of the panic is closer to now.

In the four weeks from Friday September 12, 2008, just before the Lehman bankruptcy, through Friday October 10, the S&P 500 fell by a huge 28 percent. But the decline was relatively modest (3 percent) in the first two weeks of that period, from September 12 to September 26, a year ago today. It is not unusual to see that size of change in a one or two week period. The real panic (the remaining 25 percent of that 28 percent decline in the S&P 500) occurred later, from September 26 to October 10. If you look at interest rate spreads or stock prices in other countries you see the same timing. Such facts have led me and others to be skeptical about the commonplace claim that it was simply the decision not to intervene and bail out Lehman's creditors that triggered the panic. Rather I focus on the chaotic rollout of the TARP which began later and continued through October 13 when its ultimate use was finally defined.


This view is laid out in Getting Off Track as well as in a Wall Street Journal column by John Cochrane and Luigi Zingales and an Arizona Republic column by Robert Robb. An event study using the S&P 500 is in this box from the new Global Financial Crisis Edition of my Principles of Economics with Akila Weerapana.

Wednesday, September 23, 2009

Why Triple IMF Resources Now?

As the G20 Leaders travel to Pittsburgh this weekend they should reconsider their April 2 decision “to treble the resources available to the International Monetary Fund (IMF) to $750 billion.” Why? First, the IMF does not need the money: as the first chart shows, it has loaned only a small fraction (7%) of the targeted $750 billion, even less than it loaned in severe emerging market crisis period of 1995-2003. (The IMF uses SDRs to measure loans: SDR= $1.6). Second, emerging market economies have recovered from the worst of the financial crisis. In fact, according to the purchasing managers index shown in the other chart, they bottomed out in December of last year, well before the April G20 decision to treble resources. Third, providing too many resources to any government institution can be harmful. Discipline is lost without a budget constraint. Even with the best intentions, resources are wasted or misused. Excess resources become a slush fund leading to mission creep, unpredictable policies, and more crises. For more details on the data in the charts see my essay in the useful book edited by Alexei Monsarrat and Kiron Skinner prepared for the G20 meeting.

Tuesday, September 22, 2009

Alarming Debt Charts


Simple charts vividly demonstrate the immensity of the exploding debt problem now faced by the United States. The large expansion of debt in World War II looks like a small blip compared to what's coming if we do not change policy. Click here to see the charts I used to compare U.S. debt history with CBO projections in my Economics lectures at Stanford today. The source is the spreadsheet for CBO's alternative fiscal scenario in its June Long-Term Budget Outlook.

Monday, September 21, 2009

The Crisis: A Failure or a Vindication of Economics?

Today was the first lecture of thirty-five or so lectures I will give this fall in Stanford’s Economics 1, the namesake of this Blog. Enrollment is way up. The financial crisis is naturally generating a great deal of interest in economics.

In the meantime, the financial crisis is generating a great deal of hand-wringing and debate among economists about their subject. This summer a cover of The Economist magazine shows a book titled “Modern Economic Theory” melting into a puddle to illustrate “What Went Wrong with Economics.” It was the most talked about issue of the year. This is an important debate, and the different positions deserve to be covered in the basic economics course.

Some economists are calling for a complete redo of economics—or for a return to a version of the subject popular thirty years ago. They say that economics failed to prevent the crisis or even led to it. Many of these economists argue for a more interventionist government policy, saying that John Maynard Keynes was right and Milton Friedman was wrong. Paul Samuelson was one of the first to speak out this way, saying in January in an interview in the New Perspectives Quarterly (Winter 2009), “today we see how utterly mistaken was the Milton Friedman notion that a market system can regulate itself… This prevailing ideology of the last few decades has now been reversed…I wish Friedman were still alive so he could witness how his extremism led to the defeat of his own ideas”. Paul Krugman’s longer piece two weeks ago in the New York Times Magazine (September 7, 2009) started off another round of debate. He faults modern economics (espeically modern macroeconomics) for bringing on the crisis. He says it focuses too much on beauty over practicality and does not recognize the need for more government intervention to prevent and cure the crisis. His fix is to add more psychology to economics or to build better models of credit.

But there are other opposing views to cover. In my view, the financial crisis does not provide any evidence of a failure of modern economics. Rather the crisis vindicates the theory. Why do I say this? Because the research I have done shows that the crisis was caused by a deviation of policy from the type of policy recommended by modern economics. It was an interventionist deviation from the type of systematic policy that was responsible for the remarkably good economic performance in the two decades before the crisis. Economists call this earlier period the Long Boom or the Great Moderation because of the remarkably long expansions and short shallow recessions. In other words, we have convincing evidence that interventionist government policies have done harm. The crisis did not occur because economic theory went wrong. It occurred because policy went wrong, because policy makers stopped paying attention to the economics.

Sunday, September 20, 2009

Is the Stimulus Working?

My recent Wall Street Journal column with John Cogan and Volker Wieland looked at the data available so far and concluded that there has been no noticeable impact. CNBC's Steve Liesman takes the other side in a debate with me on the the Kudow Report last Thursday.

Many asked me how we control for other factors, such as oil prices, in such studies; the answer is to use regression techniques as in this AEA paper. A contrast between Keynesian and more modern macro models is found in this robustness analysis by Cogan, Cwik, Taylor, and Wieland