Short video clips are a good way to get students interested in economics and help them understand the basics. I especially like the Golden Balls video for teaching game theory and Milton Friedman's classic telling of the pencil story for teaching price theory. The videos of Gerald Ford telling a joint session of Congress to "Whip Inflation Now"and of Arthur Burns telling a congressional committee that he would not increase the money supply are really good for macro.
2010 was a great year for new videos especially new cartoons, about which Amity Shlaes just posted a thoughtful article, Economics By Cartoon .
Here are some new videos which I think would be useful in the classroom if placed in context and used to generate discussion.
Quantitative Easing Explained. Already a classic, a friend first sent this to me by email on Nov 14, when it "only" had 100,000 downloads. It since went viral with 4 million downloads. Purists will note that it doesn't get everything right, but the overall message is clear and correct; it will be good for generating class discussion, though it is particularly brutal in places. As Amity Shlaes points out, cartoon economics allows for a more basic "no holds barred" discussion with good "off the wall" questions, just the kind you want in an introductory economics class.
The Wrong Financial Adviser Created by my Stanford colleague and Nobel prize winner Bill Sharpe, this one uses the same cartoon making program used to create Quantitative Easing Explained, but, rather than taking on the Fed, it takes on financial advisers who charge too much and don't deliver much value to investors. It has not gone viral yet, but it should because it satirically conveys important truths about investing. Combined with Burt Malkiel's new little book Elements of Investing, with Charles Ellis, it will help students remember the lessons beyond the classroom when it really matters.
Bernanke on the Daily Show with Jon Stewart. This video includes a fascinating segment from two different episodes of 60 Minutes, in which the chairman gives two different answers about whether quantitative easing is printing money. Having students sort this one out will be a good "big think" exercise.
Unmasking Interest Rates, Honky Tonk Style. Produced by Paul Solman, this PBS video covers the monetary policy debate as of January 2010 and thus before QE2. It is pretty long for playing in class unless you edit or only play part. Here is a shorter version of the musical parts where (after a short intro by me) Merle Hazard sings "Inflation or Deflation"
Movie trailers can also prove useful if explained and put in context. The Inside Job Trailer and the Waiting for Superman Trailer are both very good as they address current events with deep economic significance. There is also a good clip of French Finance Minister Christine Lagarde from the movie Inside Job.
Finally I cannot forget to mention the very popular Hayek-Keynes rap "Fear the Boom and Bust" which came out in January 2010 and now has 1.7 million downloads.
Friday, December 31, 2010
Wednesday, December 29, 2010
Models Used for Policy Should Reflect Recent Experience, But Do They?
Data from the Department of Commerce show that short-term stimulus funds did not go to increase federal purchases, or state and local purchases, or even consumption purchases by much over the past few years. Thus the packages did not materially stimulate GDP or employment. In a recent Commentary piece “Where Did the Stimulus Go?" John Cogan and I review and explain our empirical research using these data.

Unfortunately, most Keynesian models have been not adjusted to incorporate these facts, so they keep making the same predictions. To cite one example, the multipliers in Mark Zandi’s model as of July 2008 are found here (page 52 of the full document, 5 of the paper) while the multipliers as of December 2010 are found here. They are virtually the same. The model assumes a multiplier from a temporary tax rebate or refund which is greater than one, even though the actual data show it was much less than one in the case of the 2008 and 2009 stimulus packages. Note that the model also assumes a multiplier from a permanent tax cut which is only about 1/3. The relative sizes of permanent and temporary effects are exactly the opposite of what basic economics implies.
Using such results people write stories like this one “Zandi Analyses Show ‘Democratic’ Measures in Tax Cut-UI Deal Boost Economy, ‘Republican’ Measures Add to Deficit Risks” from the Center of Budget and Policy Priorities, supposedly because Democrats favor temporary actions and Republicans favor permanent actions. But the “analyses” are simply old simulations from models which appear to be ignoring the facts. More consistent with the facts and the theory is that the recent tax deal will be more beneficial to the economy than the past stimulus packages because it extends the Bush tax cuts and thus makes them more likely to be permanent.
Another example of the problem with the modeling assumptions is the multiplier from “general aid to state governments,” which is assumed to be 1.36 in the Zandi model. Yet the Commerce Department data are very clear that virtually none of this aid to state governments in the 2009 stimulus (ARRA) went into government purchases; most went to reduce borrowing. Here is a diagram from the Commentary article which shows this. You cannot get a multiplier of 1.36, or even much greater than zero, when none of the funds went to government purchases and more than half went to reduced borrowing.
Tuesday, December 28, 2010
Impacts of Proposed Changes in the Fed’s Mandate
A few weeks ago Paul Ryan and I wrote an article proposing changes in the Federal Reserve Act. One change would require the Fed to focus on "the single goal of long-run price stability within a clear framework of overall economic stability.” Since then some have argued that changing the dual mandate in this way would not have prevented the recent highly discretionary monetary policy, which, in my view, has on balance been counterproductive. For example, Greg Mankiw writes on his blog that “If the Fed's mandate were different, monetary policy today might well be the same. That is, with inflation now below its target, the Fed could be pursuing QE2 even if it were operating under the proposed mono mandate.” Similarly, in today’s Wall Street Journal Marc Sumerlin writes that such a change would “actually be supportive of the Fed’s current program.”
But there are several reasons to believe that QE2 would not have happened had Fed officials not been able to refer to a dual mandate in the Federal Reserve Act as justification for the intervention. First consider this bit of emprical evidence: There have never been so many references to the dual mandate by Fed officials as in the past year or so. If the dual mandate was not a factor in justifying and embarking on QE2, then why did Fed officials find the need to refer to it so much as justification for QE2 in the past year? In contrast, during the 1980s and 1990s, Federal Reserve officials rarely referred to the dual mandate (even in the early 1980s when unemployment was higher than today), and when they did so it was to make the point that achieving the goal of price stability was the surest way for monetary policy to keep unemployment down. Now, as Paul Ryan and I put it, “Advocates of aggressive Fed interventions cite the ‘maximum employment’ aspect of the Fed’s dual mandate.”
What about the argument that an inflation rate below the Fed’s target is alone enough to rationalize the unorthodox QE2 policy? I do not agree with this because the current low interest rate policy without QE2 is what is appropriate to deal with inflation being below the target. For example, the Taylor rule says that the federal funds rate is where it is because inflation is below its target. In other words that low interest rate policy means that monetary policy is doing what it should be doing to combat "too low" inflation, without QE2. Moreover, I think it would have been much harder to drum up support for QE2 based solely on deflationary concerns. As the Bloomberg graph below on breakeven inflation (USGGBE10) shows, the dip in expected inflation was quite small in 2010 and an argument based on that alone would not have carried the day in my view.
I have long been in favor of the Fed setting a target for inflation but not for unemployment. Here is a paper I gave at the 1996 Jackson Hole conference which explains why. In brief, by trying to focus on unemployment the Fed has actually increased unemployment. That was true in the 1970s and it is true recently: If the Fed had not kept interest rates so low when inflation was rising and the economy was growing in the 2002-2005 period, then we would have avoided much of the boom and the bust which eventually caused the devastating increase in unemployment.
One source of disagreement in debates about the mandate (which I tried to clarify in the 1996 paper) is confusion over the difference between the Fed’s goals and what the Fed reacts to. These are two different things. In particular, Sumerlin’s assessment that the Fed should react to credit aggregates is not inconsistent with the proposed changes in the mandate. Just as cutting interest rates in a recession when GDP falls below potential is an essential part of achieving a price stability goal in the framework of economic stability, so may be raising interest rates in a credit boom. The key idea is for the Fed to have and to lay out a strategy to achieve its goal. The strategy could entail credit aggregates, but that is a debate about how to achieve the mandate, not about the mandate itself.
Sunday, December 19, 2010
Putting New Fed Policy in the Economics Textbooks
Every Friday the economists at JP Morgan issue a useful compendium of facts and analysis called Global Data Watch. I've been reading GDW for many years, and I recall the days when it was only available in the paper edition.
Last Friday the economists moved a bit outside their data lane into undergraduate teaching with a major criticism that economics textbooks failed to teach students about the increase in excess reserves in the past two years. Their piece is called Blame the Textbook, Not the TA, for the Money Multiplier Confusion. Of course textbooks are not updated every week like GDW so it takes a while for them to reflect the latest developments. Nevertheless, the latest edition of my Principles of Economics text with Akila Weerapana, which has already been out for a year and a half now, does cover this increase in reserves and related developments. On page 635 of the 6th Edition, the Global Financial Crisis Edition, there is an explanation for the massive increase in excess reserves in a section called "The Explosion of Reserves and the Reserve Ratio in 2008." I agree that it is important to teach students these developments in monetary economics and policy, so I reprint that section below. By the way there is an explanation of quantitative easing on page 750 of the same text.
From Principles of Economics, p. 635
"Banks sometime hold more than the required amount of reserves at the Fed and the reserve ratio can rise above the required reserve ratio. In our examples so far we have assumed that the reserve ratio is constant. In this section we explain what can happen when the reserve ratio changes. We focus on a particularly interesting real world example.
"In the fall of 2008 reserves at the Fed started increasing at a very rapid rate. As in our examples in the previous section, the Fed increased reserves by purchasing bonds and paying for them by creating deposits. However, in this case the Fed purchased very large amounts of bonds and other securities issued by private firms rather than the Federal government as it usually does. And it also made loans to private financial firms in an effort to contain the financial crisis. The Fed reasoned that by buying the bonds it could drive the interest rate on those bonds down which would ease the financial crisis. It also reasoned that making loans to certain financial firms would help them avoid bankruptcy and reduce risks to the financial system.
"When the Fed purchased these bonds and made the loans it paid for them by creating reserves—crediting banks with deposits at the Fed. The increase in reserves was unprecedented. Figure 4 shows how large, sudden, and unusual the increase was. After remaining relatively steady, reserves exploded in the fall of 2008. They increased from $44 billion in August 2008 to $858 billion in January 2009, more than a 20 fold increase.
Demand deposits at banks also increased as a result of this increase in reserves, which is not surprising given the connection between deposits and reserves explained in the previous section. The increase in demand deposits at banks is also shown in Figure 4. "Note that the increase in demand deposits was not as large as one would expect if the reserve ratio was constant. In fact, as shown in Figure 5, the reserve ratio was not constant. It was nearly constant for a number of years but then increased sharply in the fall of 2008 as banks chose to hold some of the large increase in reserves as excess reserves over the amount they were required to hold. In other words they decided not to lend out all the reserves. Banks did not lend out all the reserves because there was not enough demand for loans and because they were concerned about risks.
"The increase in demand deposits in turn increased the money supply because demand deposits are part of the money supply. Recalling earlier periods of high money growth, some people became concerned that the increase in the money supply would cause inflation, and they criticized the Fed for increasing the money supply by such a large amount. However, the Fed indicated that it did not see inflation as a problem. Policy officials were more concerned about the financial crisis. They indicated that if inflation picked up they would be able to reduce the amount of reserves and reduce deposits and the money supply."
"In the fall of 2008 reserves at the Fed started increasing at a very rapid rate. As in our examples in the previous section, the Fed increased reserves by purchasing bonds and paying for them by creating deposits. However, in this case the Fed purchased very large amounts of bonds and other securities issued by private firms rather than the Federal government as it usually does. And it also made loans to private financial firms in an effort to contain the financial crisis. The Fed reasoned that by buying the bonds it could drive the interest rate on those bonds down which would ease the financial crisis. It also reasoned that making loans to certain financial firms would help them avoid bankruptcy and reduce risks to the financial system.
"When the Fed purchased these bonds and made the loans it paid for them by creating reserves—crediting banks with deposits at the Fed. The increase in reserves was unprecedented. Figure 4 shows how large, sudden, and unusual the increase was. After remaining relatively steady, reserves exploded in the fall of 2008. They increased from $44 billion in August 2008 to $858 billion in January 2009, more than a 20 fold increase.
Demand deposits at banks also increased as a result of this increase in reserves, which is not surprising given the connection between deposits and reserves explained in the previous section. The increase in demand deposits at banks is also shown in Figure 4.
"Note that the increase in demand deposits was not as large as one would expect if the reserve ratio was constant. In fact, as shown in Figure 5, the reserve ratio was not constant. It was nearly constant for a number of years but then increased sharply in the fall of 2008 as banks chose to hold some of the large increase in reserves as excess reserves over the amount they were required to hold. In other words they decided not to lend out all the reserves. Banks did not lend out all the reserves because there was not enough demand for loans and because they were concerned about risks."The increase in demand deposits in turn increased the money supply because demand deposits are part of the money supply. Recalling earlier periods of high money growth, some people became concerned that the increase in the money supply would cause inflation, and they criticized the Fed for increasing the money supply by such a large amount. However, the Fed indicated that it did not see inflation as a problem. Policy officials were more concerned about the financial crisis. They indicated that if inflation picked up they would be able to reduce the amount of reserves and reduce deposits and the money supply."
Saturday, December 18, 2010
Futures Market Forecast of a Federal Funds Rate Increase Likely to be Appropriate
According to the federal funds futures market, the Fed will begin raising rates sometime next year—with the federal funds rate reaching about ½ percent by December 2011. In fact, rising rates next year has been the implicit forecast of the futures market for the past year—except for the month of October during which many FOMC members were promoting quantitative easing. As this chart of the price of a December 2011 futures contract shows, a year ago the forecast was for a funds rate of over 2 percent next by the end of 2011. (The implicit forecast is obtained by subtracting the price in the chart from 100). Expectations of tightening have been rising again since the start of November, though thus far by a small amount.
This forecast is consistent with the Taylor rule and most recent forecasts for GDP growth and inflation. In fact, in my view it understates the interest rate that is likely to be appropriate by next December.
Most recent data (through the 3rd quarter) show that the inflation rate is about 1.2 percent (GDP deflator over the last four quarters) and the GDP gap is about 4.8 percent (average of San Francisco Fed survey). This implies an interest rate of 1.5 X1.2 + .5X(-4.8) + 1 = 1.8+ -2.4 +1 = .4 percent which is close to where we are now. But most likely GDP growth will turn out to be above potential growth in the 4th quarter bringing the gap down (Macro Advisers are projecting 3 percent with potential at 2.25 percent and JP Morgan is projecting 3.5 percent). Inflation is also very like to rise by this measure. For these reasons an increase in the federal funds rate next year is consistent with the Taylor rule.
Wednesday, December 8, 2010
Stimulus Math: Many Multiples of Nothing is Still Nothing
In an article in tomorrow’s Wall Street Journal, John Cogan and I review our research showing why the 2009 stimulus package did little to stimulate the economy, despite its large size. The reserch continues our earlier work showing why the temporary increases in transfers and tax rebates in the 2008 and 2009 stimulus packages did not work to stimulate the economy. Tomorrow's article reports data showing that state and local governments did not increase their purchases of goods and services—including infrastructure—even though they received large grants in aid from the federal government. Instead they used the grants largely to reduce the amount of their borrowing as the following graph dramatically shows.  As American Recovery and Reconstruction Act (ARRA) grants from the federal government rose, the amount of net borrowing by state and local governments declined. The data come from the Bureau of Economic Analysis, Department of Commerce. The level of purchases is much less than government officials predicted when ARRA was passed in early 2009.
As American Recovery and Reconstruction Act (ARRA) grants from the federal government rose, the amount of net borrowing by state and local governments declined. The data come from the Bureau of Economic Analysis, Department of Commerce. The level of purchases is much less than government officials predicted when ARRA was passed in early 2009.
Tuesday, December 7, 2010
Back to the Ad Hoc Age
The title and the content of Gillian Tett’s short article “Goodbye Moderation, Hello to the Ad Hoc Age,” (FT, Nov 26, reprinted here) describe succinctly the remarkable swing in the pendulum from rules towards discretion in policy in recent years. In my view, this swing is a major reason for the end of the great moderation and the painfully protracted slump in the United States, as Tett describes in the article. She also expands on the idea by incorporating the government-caused debt mess and bailout operations in Europe.
Having been bombed back to the Ad Hoc Age we can only hope it is a lot shorter than the Stone Age, but the first step in ending it is understanding what happened, and this short article is very helpful in this regard.
Having been bombed back to the Ad Hoc Age we can only hope it is a lot shorter than the Stone Age, but the first step in ending it is understanding what happened, and this short article is very helpful in this regard.
Wednesday, December 1, 2010
Toward Price Stability Within a Framework of Economic Stability
Today Congressman Paul Ryan and I published an article explaining the rationale for a reform of the Federal Reserve Act to establish a single “goal of long-term price stability within a framework of economic stability, including clear reporting and accountability requirements.” As part of the reporting framework the Fed would “explicitly publish and follow a monetary rule as its means to achieve price stability.” The Fed would have the discretion to choose its own rule or strategy and it “should have the discretion to deviate from its strategy,” but be accountable when if it did so: “it should have to promptly report to Congress and to the public on the reasons for the deviation”
Some have asked how such a proposal would have worked recently. That depends very much on what rule or strategy the Fed had chosen. Suppose, for example, they had chosen the rule that I proposed a number of years ago, which described Fed policy well in most of the 1980s and 1990s as Bill Poole showed in his article Understanding the Fed when he was president of the St. Louis Fed. With inflation now below the two percent target and the economy still in a slump, that rule would now be calling for a federal funds rate close to, or just slightly above, what it is now, not the minus six percent that advocates of QE2 refer to as justification for such a highly unconventional policy.
Equally important, interest rates would not have been held so low in 2002-2004 which was one of the reasons for the financial crisis. Of course the Fed might have chosen a different rule, but then we would at least have had the opportunity for public discussion and understanding of its strategy for monetary policy. The proposed reporting and accountability requirements would restore the requirements that were removed in 2000 (as explained here), but with an emphasis on a rule for policy rather than ranges for the growth of the monetary aggregates.
Tuesday, November 23, 2010
A Proposal to Restore Reporting and Accountability Requirements for the Fed
In a speech in Washington last week I made a proposal to restore the legislative requirement that the Fed report and be accountable for its strategy for monetary policy. Such a requirement was the law throughout the 1980s and 1990s, but was removed in 2000. There is a big difference, however, between the old law and what I proposed. The old law focused on reporting about the “ranges of growth or diminution of the money and credit aggregates,” while the new law would focus on the “strategy, or rule, of the Board and the FOMC for the systematic adjustment of the federal funds rate in response to changes in inflation and in the real economy needed to achieve the price stability objective.” Money would still be a factor in the strategy in that the interest rate would be determined in the money market through the demand and supply of money. The Fed would have the discretion to choose the strategy, but would be required to explain in writing and in hearings any deviations from the strategy. One possible strategy could be the Taylor rule, but the Fed could choose any rule as long as it stuck with it or explained why it deviated from it. .
Here is some press reaction to the proposal
Bloomberg News: “Taylor Proposes Altering Fed Law to Require 'Systematic' Rate Setting Rule”
Dow-Jones: "Stanford’s Taylor Urges Turning Monetary Policy Rules Into Law to Limit Fed”
Reuters: “Economist Taylor Wants New Law for Fed Policy"
Globe and Mail: “A Rules Based Fed?”
Another reaction, not covered in these articles, came from some of the people who had experience at the Fed in the 1980s and 1990s. They say that they found the old reporting and accountability requirements to be of value in creating a process at the Fed for discussing a monetary strategy and that the new requirements could be of similar benefit.
Sunday, November 21, 2010
The End of the Recrudescence of Keynesian Economics
This past weekend Columbia University hosted a conference on the occasion of the 40th anniversary of the famous Phelps volume on the micro foundations of macroeconomics. In addition to the technical papers, which will eventually be published in a conference volume, important lunch and dinner talks were given by two of the most recent Nobel Prize winners in economics--Dale Mortenson and Chris Pissaredes--as well as by Fool’s Gold author Gillian Tett of the FT and Ned Phelps.
Ned spoke about what he called the “recrudescence of Keynesian economics.” He explained why, as he put it in his New York Times column of last August, “The steps being taken by government officials to help the economy are based on a faulty premise. The diagnosis is that the economy is ‘constrained’ by a deficiency of aggregate demand. The officials’ prescription is to stimulate that demand, for as long as it takes, to facilitate the recovery of an otherwise undamaged economy — as if the task were to help an uninjured skater get up after a bad fall. The prescription will fail because the diagnosis is wrong.”
The problem with these Keynesian policies is that at best they give short term boosts to the economy, but then fizzle out as we are seeing now. Sustaining growth in employment requires sustaining investment, which requires government policy that encourages investment and innovation, not short-run stimulus packages that try to boost consumption and government purchases, which crowd out investment.
.
Will there be an end of this recrudescence? Politics as well as economics will be an important determining factor, at least that’s what the historical analysis in the paper I presented at the conference shows. The good news then is that more people are beginning to see the problems with these stimulus packages and the political process is responding.
Note, however, that Russ Roberts has an alternative and quite plausible "political economy" explanation for why policymakers tend to choose interventionist policies such as discretonary Keynesian stimulus packages.
Friday, November 19, 2010
The 2010 Little Big Game in Economics
 Once a year, in November, the graduate students in the Stanford and Berkeley Economics Departments get together for the Little Big Game, a series of contests in basketball, volleyball, Frisbee, touch football, and soccer. The Little Big Game takes place in the days before the Big Game between the Stanford-Cal varsity football teams. This year the Little Big Game was held at Berkeley, where the Big Game between 6th ranked Stanford and unranked Berkeley will take place tomorrow.
I am happy to report that the Little Big Game was great this year for the Stanford team, which racked up 3-1-1 won-loss-tie record, much better than last year’s 2-3 record. Stanford won in basketball, volleyball, and Frisbee, lost in football, and tied in soccer.
Stephen Terry, a second year Stanford Ph.D. student, explained the victory in the post-game wrap up, saying “I give the first year students’ credit for this one, especially Isaac Opper who led Stanford in almost all of the games. But of course we shouldn't forget our t-shirts. We rule!”
In case you’re wondering, I've included a picture of the front and back of the Stanford economics team’s t-shirt uniform for this year’s Little Big Game.
Monday, November 15, 2010
The QE2 Letter
Many have asked me what I think about the letter criticizing QE2 which was signed by me and other economists. The letter has created quite a stir. I have already written and spoken many times explaining my oppostion to QE2, both before the decision was made and afterwards, so it might be helpful just to give a list of posts on this blog and some media interviews:
Jackson Hole, August 29 "the benefits in terms of lower rates are very small, while the short-term costs of greater uncertainty about the exit strategy and long-term costs from a loss of independence are large."
The Taylor Rule Does Not Say Minus Six Percent, September 1
it says .75 percent which provides no rationale for QE2
More on Massive Quantitative Easing, September 8 which refers to a WSJ oped and many other critiques
Announcement Effects Do Not Prove QE Works, October 7 so the evidence cited in favor of QE2 is pretty weak
A New Normal for Monetary Policy? October 27 reflects my concerns that there would be a QE3 and a QE4. Maybe the letter and other objections will reduce the chances of this.
Milton Friedman Would Certainly Not Have Supported QE2, November 3 so be careful about citing him as support
Empirical Concerns about Anticipation Effects of QE2, November 5 which disagreed with the Washington Post article by Ben Bernanke defending QE2
QE2 and G20, November 14 in which an unintended consequence of QE2 is discussed
I have also done many TV interviews, from this interview with Steve Liesman on October 15 at the Boston Fed before QE2 was announced to this one last week on Squawk Box. To hear both sides of the issue discussed togehter, view this Newshour program with Alan Blinder and me which was also aired on October 15, or listen to this NPR program On Point with Jeremy Siegel and me. An earlier QE2 debate took place on Squawk Box on October 8 in which Jim Bullard President of the Federal Reserve Bank of St. Louis and Larry Meyer also appeared.
Sunday, November 14, 2010
QE2 and G20
An unintended consequence of QE2 has been the strong openly voiced opposition from some of America’s traditional allies as well as those countries, like China, perceived to be on the other side of the bargaining table. So the Fed is affecting U.S. foreign policy, and the fact that President Obama has had to defend the Fed in other countries raises questions about the Fed’s independence.
The administration’s main defense is that a growing U.S. economy is good for the world. While a strong U.S. economy is certainly good for the world, it is not so clear that QE2 will help the U.S. economy grow more strongly. I have argued that QE1 did not have much positive stimulus effect and the same is likely to be true for QE2 as I explained for example in this recent interview. Moreover, if the Fed thinks that quantitative easing helps by depreciation of the dollar, that policy certainly does not help demand in other countries.
But the insertion of QE2 into the negotiations was not the reason that the United States came away with so little at the G20 meeting in South Korea. The same thing happened at the previous Q20 meeting in Canada and there was no QE2 then. As I wrote at the time of the Canadian finance ministers and central bank governors meeting, the problem with the U.S. position then and now is that the idea that more deficit spending stimulus is needed to increase demand is an idea that other countries strongly disagree with, and in my view they are right. Indeed, the G20 has been getting on the right track despite the U.S. postion. The United States was able to sell stimulus packages to the G20 in early 2009, but most see that it has not done much good and has made the debt higher. The way to have a more successful G20 meeting in France next year is for the United States to go with a credible plan to reduce the budget and stop increasing the debt.
Friday, November 5, 2010
Empirical Questions About the Anticipation Effects of QE2
No doubt there will be many empirical studies evaluating the impact of the Fed’s November 3 decision to begin another dose of quantitative easing (QE2). Ben Bernanke gave his first assessment of the impact of QE2 in an op-ed yesterday in the Washington Post. He argued that QE2 started working even before the decision on November 3. In particular he wrote that:
“Stock prices rose and long-term interest rates fell when investors began to anticipate the most recent action.”
How can one determine whether stock prices rose and long-term interest rates fell in anticipation of QE2? Obviously it is very difficult because many other things affect stock and bond markets, and one can never know for sure, but the data presented in the following charts raise serious doubts that such anticipation effects were either substantial or sustainable.
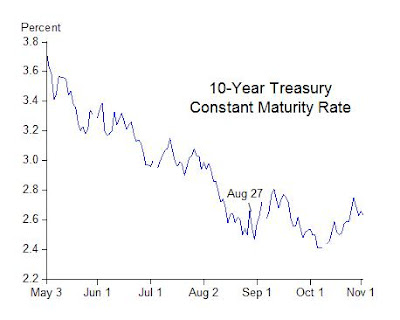
First consider long-term Treasury interest rates. The first chart shows the interest rate on benchmark 10-year Treasury bonds. Note that these long-term interest rates had been coming down since May—long before markets could reasonably have anticipated another large dose of quantitative easing. They have been relatively flat since August. But to assess more formally whether long-term interest rates fell “when investors began to anticipate” QE2, one must consider a date or dates on when such anticipations are likely to have begun.
“Stock prices rose and long-term interest rates fell when investors began to anticipate the most recent action.”
How can one determine whether stock prices rose and long-term interest rates fell in anticipation of QE2? Obviously it is very difficult because many other things affect stock and bond markets, and one can never know for sure, but the data presented in the following charts raise serious doubts that such anticipation effects were either substantial or sustainable.
First consider long-term Treasury interest rates. The first chart shows the interest rate on benchmark 10-year Treasury bonds. Note that these long-term interest rates had been coming down since May—long before markets could reasonably have anticipated another large dose of quantitative easing. They have been relatively flat since August. But to assess more formally whether long-term interest rates fell “when investors began to anticipate” QE2, one must consider a date or dates on when such anticipations are likely to have begun.
One logical date is August 27, the day of Ben Bernanke’s Jackson Hole speech where he discussed the framework of quantitative easing in detail. Indeed, this Jackson Hole speech is frequently mentioned in the financial press. The date of the speech is shown in the chart. The long-term rate was 2.66 percent on that date. If anticipations of quantitative easing lowered long-term interest rates, then one would expect this rate to have been lower on November 2, the day before the FOMC’s recent action. But this is not what happened. The interest rate was the same 2.66 percent on November 2 as it was on August 27.
What about other long-term interest rates? The second chart shows the interest rates on Moody’s Aaa and Baa corporate bonds. On November 2 the Moody’s Baa corporate rate was 5.71 percent compared with 5.62 percent on August 27. And on November 2 the Aaa rate was 4.66 percent compared with 4.41 percent on August 27. In both cases rates were higher, rather than lower, compared with what rates were on the day investors could plausibly have begun to anticipate the recent action. Next consider stock prices. The third chart shows the S&P 500 index over the same period. Observe that the current rally began in early July as shown in the chart. Evidently concerns about a double dip recession had diminished by early July and earnings reports began improving. From July 2 to August 10 the S&P 500 rallied by 10 percent. That rally was temporarily interrupted starting on August 10, but then continued. From August 10 to November 2 the S&P 500 rose another 7 percent.

Any assessment of the impact of anticipations of QE2 on stock prices depends crucially on how one interprets this rally and the interruption around August 10. It is important to note that August 10 was the day of the FOMC meeting where the Fed first indicated it would reinvest the maturing mortgage backed securities into the Treasury market, so this first hint of quantitative easing had a negative impact on stock prices. This was also the meeting where the Fed appeared to be very downbeat about the economy and revealed considerable dissention among FOMC members about how policy decisions would be made going forward. Jon Hilsenrath later wrote about this meeting in detail in the Wall Street Journal calling it "among the most contentious in Ben Bernanke's four and a half year tenure as central bank chairman." Hence, the large negative impact on stock prices is understandable.
Ben Bernanke’s August 27 Jackson Hole speech was helpful in this regard because it undid the damage of the August 10 meeting, as I argued at the time, by presenting a transparent framework for making decisions and conveying the image of a more functional FOMC than portrayed, for example, in Hilsenrath’s article. So in my view, the consistent story is that the August stock market dip was Fed-induced and its reversal was also Fed-induced. In contrast an explanation based on anticipations of quantitative easing is inconsistent because stock prices went one way on August 10 and another way on August 27.
In any case these interest rate and stock price data raise doubts about the narrative that long-term interest rates fell and stock prices rose in anticipation of QE2. As with all the other stimulus programs tried in recent years, it is important to get the narrative right, and more empirical work is welcome.
Wednesday, November 3, 2010
Certainly Milton Friedman Would Not Have Supported QE2
Many have asked whether Milton Friedman would have favored the type of massive quantitative easing which the Fed embarked on today. I have argued that he would not. In tomorrow’s Wall Street Journal, Allan Meltzer addresses the question and concludes even more forcefully: “I am certain he would not.” See also the piece in today's Financial Times by Martin Feldstein with similar criticism of quantitative easing.
One issue which is not addressed by these pieces is the argument that the rise in the stock market since late August, when Ben Bernanke started the march toward QE2 at Jackson Hole, is evidence in support. I view the stock market behavior differently. The recent rally began in July, but was interrupted by the highly argumentative and downbeat FOMC meeting on August 10, which Bernanke clarified in Jackson Hole on August 27, and then the rally continued, bolstered by good earnings reports and strong growth abroad, not, in my view, by anticipations of quantitative easing.

But at times like these we need a little humor. This cartoon is from the collection of Hank Blaustein posted on Jim Grant's Interest Rate Observer web page, where you can purchase this and other cartoons in a 4" x 4" reproduction, signed by the artist.
Saturday, October 30, 2010
More Evidence on Why the Stimulus Didn't Work
Polls show that most Americans don't believe that the stimulus package worked, but debate continues among economists. The most debated issue is the size of government purchases multiplier. Suppose that the government purchases multiplier is 1.5. Then Economics 1 students learn that the change in GDP due to an increase in government purchases is found by multiplying the change in government purchases by 1.5. That is:
change in GDP =1.5 times change in government purchases
Government purchases include spending on items such as infrastructure, law enforcement, and education, but do not include interest and transfer payments. (A derivation is in Ch. 23 appendix of the Taylor-Weerapana principles text.)
The example of 1.5 is at the upper range of estimates, and was used in a paper by Christina Romer and Jared Bernstein to estimate the impact of the American Recovery and Reinvestment Act of 2009 (ARRA). However, John Cogan, Volker Wieland, Tobias Cwik, and I found that the multiplier in the case of ARRA was much smaller, around .7. Robert Barro argues that it is zero. So there is debate.
But few have focused on the second term in the above multiplier formula: the change in government purchases due to ARRA. John Cogan and I have been tracking data on the changes in government purchases since ARRA was passed, using a new data series provided by the Commerce Department. We just finished a working paper reporting the details of our findings, which provide additional evidence that the stimulus has not worked and, just as important, on why it has not worked.
Despite the gigantic $862 billion stimulus package, the change in government purchases due to ARRA has been immaterial to the economic recovery: government purchases increased by only 2 percent of the $862 billion package ($18 billion). Infrastructure was even less at $2.4 billion. There has been almost no change in government purchases for the multiplier to multiply. It’s no wonder people don’t think the stimulus worked. And the size of the multiplier is largely irrelevant!
Our research looks at both federal and state and local purchases. Federal purchases due to ARRA reported by the Commerce Department are very small. We also find that large ARRA grants to the states did not increase state and local government purchases at all. To check our results we traced where the grant money went (it went mainly to reduce state borrowing) and we considered counterfactuals (in the absence of ARRA, government purchases would likely have been higher). The chart below summarizes the findings with all the government purchases at the federal level. The implication of this research is not that the stimulus program was too small, but rather that such countercyclical programs are inherently limited by feasibility constraints of the federal system. John Cogan and I first reported these results in a preliminary way over a year ago in a September 16, 2009 a Wall Street Journal article with Volker Wieland, entitled “The Stimulus Didn’t Work”. Though ARRA data were then only available through the second quarter of 2009, it was clear to us that government purchases were not contributing to the recovery, and we reported that “there is no plausible role for the fiscal stimulus here.” Many dismissed our conclusion, saying it was too soon to judge. Another year of data has confirmed our results as we explain in our new working paper.
change in GDP =1.5 times change in government purchases
Government purchases include spending on items such as infrastructure, law enforcement, and education, but do not include interest and transfer payments. (A derivation is in Ch. 23 appendix of the Taylor-Weerapana principles text.)
The example of 1.5 is at the upper range of estimates, and was used in a paper by Christina Romer and Jared Bernstein to estimate the impact of the American Recovery and Reinvestment Act of 2009 (ARRA). However, John Cogan, Volker Wieland, Tobias Cwik, and I found that the multiplier in the case of ARRA was much smaller, around .7. Robert Barro argues that it is zero. So there is debate.
But few have focused on the second term in the above multiplier formula: the change in government purchases due to ARRA. John Cogan and I have been tracking data on the changes in government purchases since ARRA was passed, using a new data series provided by the Commerce Department. We just finished a working paper reporting the details of our findings, which provide additional evidence that the stimulus has not worked and, just as important, on why it has not worked.
Despite the gigantic $862 billion stimulus package, the change in government purchases due to ARRA has been immaterial to the economic recovery: government purchases increased by only 2 percent of the $862 billion package ($18 billion). Infrastructure was even less at $2.4 billion. There has been almost no change in government purchases for the multiplier to multiply. It’s no wonder people don’t think the stimulus worked. And the size of the multiplier is largely irrelevant!
Our research looks at both federal and state and local purchases. Federal purchases due to ARRA reported by the Commerce Department are very small. We also find that large ARRA grants to the states did not increase state and local government purchases at all. To check our results we traced where the grant money went (it went mainly to reduce state borrowing) and we considered counterfactuals (in the absence of ARRA, government purchases would likely have been higher). The chart below summarizes the findings with all the government purchases at the federal level. The implication of this research is not that the stimulus program was too small, but rather that such countercyclical programs are inherently limited by feasibility constraints of the federal system.
John Cogan and I first reported these results in a preliminary way over a year ago in a September 16, 2009 a Wall Street Journal article with Volker Wieland, entitled “The Stimulus Didn’t Work”. Though ARRA data were then only available through the second quarter of 2009, it was clear to us that government purchases were not contributing to the recovery, and we reported that “there is no plausible role for the fiscal stimulus here.” Many dismissed our conclusion, saying it was too soon to judge. Another year of data has confirmed our results as we explain in our new working paper.
Wednesday, October 27, 2010
A New Normal for Monetary Policy?
A year and a half ago when the Fed’s extraordinary quantitative easing (QE) was shifting from emergency liquidity programs to large scale asset purchases, we convened a conference at Stanford’s Hoover Institution to discuss the shift. Jim Hamilton, of UC San Diego, in his talk Concerns about the Fed's New Balance Sheet and Peter Fisher of Blackrock in his talk The Market View expressed serious concerns about the extraordinary policies and the use of the Fed’s balance sheet to finance them. Don Kohn, then Fed Vice-Chair, attended and defended the Fed’s position
One concern expressed at the time (March 2009) was that such extraordinary measures would become a "new normal" for monetary policy, in which the Fed would not restrict its massive doses of QE to times of panics and other emergencies. Such a new normal would likely breed uncertainty and reduce the Fed’s independence, eventually leading to economic instability and inflation. I put it this way in my paper in the book, Road Ahead for the Fed, which came out of the conference:
“The danger I see is that as the recovery begins, or after we are a couple of years into it, people may feel that it’s not fast enough, or there is an unpleasant pause. Either could generate heavy pressure on the Fed to intervene…. Why would such interventions only take place in times of crisis? Why wouldn’t future Fed officials use them to try to make economic expansions stronger or to assist certain sectors and industries for other reasons?”
Many Fed officials dismissed the concerns about such a scenario, saying that the crisis was unique. Yet this is exactly the scenario that is now playing out. Sure enough, the recovery paused, and lo and behold, there is a QE2 in the works.
Today’s Roubini Global Economics newsletter is ominous. It predicts that after QE2 the Fed will “announce QE3 (and eventually even QE4).” After Road Ahead for the Fed we published another book Ending Government Bailouts as We Know Them. Perhaps the title of the first book should have been The End of Monetary Policy as We Know It
Sunday, October 24, 2010
Cash for Clunkers in a Macro Context
More empirical studies are demonstrating that temporary fiscal stimulus actions are a poor way to get the economy moving again on a sustainable basis. More permanent and predictable policies are much better. I demonstrated this problem in the case of the stimulus packages of 2008 and 2009, but perhaps the clearest case is the “cash for clunkers” program of July and August 2009. To illustrate the problem quantitatively, it is useful to put some new micro-empirical results of Atif Mian and Amir Sufi into a macroeconomic context, as I do with the following charts.
The first chart shows disposable personal income along with personal consumption expenditures in the United States. In previous work I focused on how the two big bulges in disposable income due to the stimulus programs failed to jump start consumption. But here I focus on the cash for clunker program, which clearly did change consumption.
 Using the Mian-Sufi results, which are based on a comparison of different regions of the United States, I estimated the amount by which total personal consumption expenditures first increased as people were encouraged to trade in their clunker and purchase new cars, and then declined because many of the trade-ins were simply brought forward. To make this increase and subsequent decrease easier to see, the second chart focuses on personal consumption expenditure during the period of the program.
  You can see that consumption rises above what it would have been without the program and then actually falls below what it would have been. Some argue that bringing forward purchases like this is exactly what such programs are supposed to do, but the graph makes it very clear that the offsetting secondary effects occur so quickly that the net result is an insignificant blip in the recovery. The impact is not sustainable.
An important result of Mian and Sufi is that the positive effects are completely offset in a few months, as you can see in the picture. But even if they were not offset, the graph raises serious doubts about how such a program could sustain a recovery. Suppose that the red line never dipped below the blue line. We would still see growth simply picking up for a month and then slowing down again. That is not sustainability.
The first chart shows disposable personal income along with personal consumption expenditures in the United States. In previous work I focused on how the two big bulges in disposable income due to the stimulus programs failed to jump start consumption. But here I focus on the cash for clunker program, which clearly did change consumption.
Using the Mian-Sufi results, which are based on a comparison of different regions of the United States, I estimated the amount by which total personal consumption expenditures first increased as people were encouraged to trade in their clunker and purchase new cars, and then declined because many of the trade-ins were simply brought forward. To make this increase and subsequent decrease easier to see, the second chart focuses on personal consumption expenditure during the period of the program. You can see that consumption rises above what it would have been without the program and then actually falls below what it would have been. Some argue that bringing forward purchases like this is exactly what such programs are supposed to do, but the graph makes it very clear that the offsetting secondary effects occur so quickly that the net result is an insignificant blip in the recovery. The impact is not sustainable. An important result of Mian and Sufi is that the positive effects are completely offset in a few months, as you can see in the picture. But even if they were not offset, the graph raises serious doubts about how such a program could sustain a recovery. Suppose that the red line never dipped below the blue line. We would still see growth simply picking up for a month and then slowing down again. That is not sustainability.
Thursday, October 7, 2010
Beware of Announcement Effects When Assessing Policy Interventions
The effects of exchange market interventions are frequently estimated by looking at what happened on the day of the announcement of the intervention or of the intervention itself. But my observation—based in part on experience running the international division of the U.S. Treasury and engaging in financial diplomacy with Japan and other countries—is that announcement effects can be very misleading as an estimate of the overall effect of interventions because the impacts can wear off with no announcement or reverse interventions. The recent experience with the September 14 announcement of an exchange market intervention by the Bank of Japan is an important case in point as clearly indicated by this chart of the yen-dollar exchange rate.  The yen did noticeably depreciate against the dollar on the day that the intervention was announced and took place, but that has already been reversed.
This is one of the reasons why I think it is unwise to rely on announcement effects to assess the impact of central bank asset purchase programs as in Gagnon et al. Better to look over longer periods of time where you can control for other factors as in this paper with Johannes Stroebel.
The yen did noticeably depreciate against the dollar on the day that the intervention was announced and took place, but that has already been reversed.This is one of the reasons why I think it is unwise to rely on announcement effects to assess the impact of central bank asset purchase programs as in Gagnon et al. Better to look over longer periods of time where you can control for other factors as in this paper with Johannes Stroebel.
Monday, October 4, 2010
Meltzer’s History Lesson
I recently had the pleasure of reading, and then writing a review of, Allan Meltzer’s monumental A History of the Federal Reserve, Volume 2 which is published in Book 1 and Book 2. The lesson from this thorough 2,112-page history (volumes 1 and 2 together) deserves careful consideration by policymakers today.
It is a history of policy successes and policy failures. The failures are the Great Depression of the 1930s, the Great Inflation of the 1970s, and the Great Recession of recent years. The successes are the Great Disinflation of the early 1980s and the Great Moderation which succeeded it. What caused these successes and failures? Meltzer focuses on two types of policy errors: (1) succumbing to “political interferences or pressure” and (2) basing policy on “mistaken beliefs.” Failure comes from making one or both of these errors; success comes from avoiding them.
He argues that the Great Depression was mainly the second source of error: mistaken beliefs about the real bills doctrine. The Great Inflation was a combination of both types of errors, but failure to resist political pressure dominated because when beliefs changed in the 1970s, policies did not. The Great Disinflation was marked by an absence of both types of errors as Paul Volcker regained independence and restored basic monetary fundamentals about the impact of changes in the money supply and interest rates. The Great Moderation was a period where independence was solidified and rules-based policy, grounded in fundamentals, was followed. The Great Recession was a return to a combination of both kinds of errors, a departure from rules-based policies that worked in the Great Moderation and a loss of independence as the Fed engaged in fiscal and credit allocation policy.
Meltzer’s historical research thus leads him to conclude from the past that “Discretionary policy failed in 1929-33, in 1965-80, and now,” and to recommend for the future that “The lesson should be less discretion and more rule-like behavior.” While I registered some disagreements with parts of Meltzer’s history in my review article, I think his overall conclusion and recommendation are largely correct.
Friday, October 1, 2010
Trading Places: HIPCs and HIICs
 I thought of the movie Trading Places when I saw the term HIIC in the headline of today's Wall Street Journal article by Kelly Evans. The new term refers to the "Heavily Indebted Industrialized Countries" and of course to the exploding debt of these countries--including the United States. It was not so long ago that the main concern in the international community was the debt of the "Heavily Indebted Poor Countries," or the HIPCs; these low income countries were the focus of the debt relief, or the "drop the debt," movement.
Remarkably the debt of the advanced countries is now higher and growing more rapidly than the debt of the lower income countries, as I show in this chart based on data from the IMF's Fiscal Monitor of last May. The switch seemed to take less time than it took to change the P to an I. It's good news for the lower income counries, but not such good news for the industrialised countries which obviously have to get back on track.
Thursday, September 30, 2010
New Evidence Shows that Low Interest Rate Led To Yield Search
New empirical research establishes a strong relationship between very low interest rates set by the Fed, as in the period 2002-2005, and a risk-taking search for yield. This policy-induced lessening of risk aversion has been emphasized by Raghu Rajan and others as a key factor bringing on the financial crisis. The new empirical support for this view is reported in the working paper “Risk, Uncertainty and Monetary Policy” by Geert Bekaert, Marie Hoerova, and Marco Lo Duca.
The basic evidence is the pattern of correlations over time which can found by looking carefully through the following bar graphs and table drawn from the paper.
The basic evidence is the pattern of correlations over time which can found by looking carefully through the following bar graphs and table drawn from the paper.
The bar graphs show the correlation between market volatility, measured by VIX, and the interest rate set by the Fed, measured by RERA—the federal fund rate minus the inflation rate. The two columns of five-digit numbers in the table labeled lead and lag are the values of the correlations shown in the bars. (VIX, of course, is the implied volatility of the S&P 500. The identifier LVIX is used because they actually look at the log of VIX).
The bar graph on the left (and the first column of numbers) shows the correlation coefficients between the VIX and values of the federal funds rate at previous months going back into the past from 1 month to 36 months. For example, the correlation between the VIX and the federal funds rate 12 months earlier is 0.5057. Observe that these correlations are all positive and significant, evidence that lower interest rates are associated with lower future values of the VIX, or less risk aversion as explained in the paper. In this sense, low interest rates tend to lower risk aversion and high interest rates raise it. In other words the low rates cause a search for yield with a willingness to take on more risk.
The bar graph on the right (and the second column of numbers) shows the correlation coefficients between the VIX and values of the federal funds rate at varying months going into the future. After the first few months, these correlations are negative and significant indicating that the Fed tends to react to high levels of volatility by lowering interest rates.
The bottom line of this empirical research, as the authors put it, is that “lax monetary policy increases risk appetite (decreases risk aversion) in the future, with the effect lasting for about two years and starting to be significant after five months.” Their result is important to the policy debate because such monetary policy has been “cited as one of the contributing factors to the build up of a speculative bubble prior to the 2007-09 financial crisis.”
Policy Rule Gaps as Forecasts of Currency and Interest Rate Movements
Currency strategists at the Scotiabank are using “policy rule differentials” rather than simple “interest rate differentials” in a creative way to predict interest rate and currency movements. As reported in this Bloomberg piece Taylor Rule Gap with U.S. at 15-Year High Signals Rate Jump in Canada by Matt Walcoff and Chris Fournier, the policy rule differential is currently 275 basis points, while the current interest rate differential between Canada and US is only 75 basis points. Hence, Camilla Sutton and Sacha Tihanyi at Bank of Nova Scotia argue that the Canadian dollar and the Canadian interest rate will rise. Where do they get the 275 basis points? They estimate that the Bank of Canada is below their policy rule by 1 percentage point and that the Fed is above by 1.75 percentage points for a gap of 2.75 percentage points. Here are their calculations (scroll to page 13 of the September 10, 2010 issue). It is another example of how foreign interest rates affect central bank decisions, as I described in this recent post
Sunday, September 26, 2010
The Transparent Effect of Foreign Interest Rates on Central Bank Decisions
Last June the central bank of Norway hosted a fascinating conference in Oslo on the use of monetary policy rules in small open economies. The Norges Bank is a remarkably transparent central bank. As with the Swedish Riksbank, it announces not only its most recent interest rate decision, but also the likely path for its interest rate decisions in the future. While some have criticized publishing future interest rate forecasts, the experiences in Norway and Sweden show that there are advantages of such increased transparency. For example, consider the debate at the Risksbank earlier this month about the path of interest rates in the next two years. The Riksbank minutes (which provide much more detail than FOMC minutes) reveal a substantive debate between some, such as Deputy Governor Lars Svensson, who preferred an interest rate path in which rates were held low for a long time and others who wanted to increase rates more rapidly.
As explained in the minutes, the debate was in part over forecasts of monetary policy rate decisions abroad: “Given statements made by the Federal Reserve and the ECB, …low policy-rate expectations must be regarded as very realistic. The differential between Swedish and foreign interest rates is currently moderate. If the repo-rate was to become credible and policy-rate expectations for Sweden were to shift up to the repo-rate path, the expected differential in relation to other countries would be considerable. This would trigger substantial capital flows and lead to a dramatic appreciation of the krona. Both higher market rates and a stronger krona would entail a drastic tightening of actual monetary policy.”
More light is shed on the effect of lower interest rates abroad on policy by the experience of the Norges Bank; the effects can be illustrated using charts from their Monetary Policy Reports. Consider the decision to lower the path of interest rates in Norway earlier this year. The lower path is shown by the red line in this picture:

The Norges Bank explained this change with their useful (and very transparent) “interest rate accounting” bar chart. Observe that a big reason for the rate cut was that foreign interest rates were expected to be lower.

Further evidence is shown in the Norges Bank efforts to use monetary policy rules in their decision-making. As shown in the third graph, their interest rate path is lower than a Taylor Rule without the foreign interest rate and about the same as a policy rule in which the foreign interest rate is added to a Taylor Rule. Whether such adjustments are good or bad was the subject of my keynote address at the conference, but whatever the answer, we should be grateful for their high level of transparency which helps us research the question.
As explained in the minutes, the debate was in part over forecasts of monetary policy rate decisions abroad: “Given statements made by the Federal Reserve and the ECB, …low policy-rate expectations must be regarded as very realistic. The differential between Swedish and foreign interest rates is currently moderate. If the repo-rate was to become credible and policy-rate expectations for Sweden were to shift up to the repo-rate path, the expected differential in relation to other countries would be considerable. This would trigger substantial capital flows and lead to a dramatic appreciation of the krona. Both higher market rates and a stronger krona would entail a drastic tightening of actual monetary policy.”
More light is shed on the effect of lower interest rates abroad on policy by the experience of the Norges Bank; the effects can be illustrated using charts from their Monetary Policy Reports. Consider the decision to lower the path of interest rates in Norway earlier this year. The lower path is shown by the red line in this picture:
The Norges Bank explained this change with their useful (and very transparent) “interest rate accounting” bar chart. Observe that a big reason for the rate cut was that foreign interest rates were expected to be lower.
Further evidence is shown in the Norges Bank efforts to use monetary policy rules in their decision-making. As shown in the third graph, their interest rate path is lower than a Taylor Rule without the foreign interest rate and about the same as a policy rule in which the foreign interest rate is added to a Taylor Rule. Whether such adjustments are good or bad was the subject of my keynote address at the conference, but whatever the answer, we should be grateful for their high level of transparency which helps us research the question.
Wednesday, September 22, 2010
Senate Budget Committee Reopens Debate on Policy and the Crisis
In a hearing today, the Senate Budget Committee reopened the debate about whether the stimulus packages and other federal interventions have been effective. Here is the written testimony of Alan Blinder, Mark Zandi, and me, the three economists who were invited to testify. The chairman of the committee Kent Conrad began by outlining the results of a recent study by Blinder and Zandi (which I have previously critiqued on this blog) arguing that the packages were effective. Ranking Member Judd Gregg followed up expressing his skepticism of such studies.
My testimony summarized the results of studies conducted at Stanford during the past three years examining the empirical impact of the policies (the studies are described in the appendix).
One simple fact which I reported received considerable attention in the senators’ discussion. It was that only $2.4 billion of the $862 billion in the 2009 stimulus package (ARRA) has been spent on federal infrastructure—three-tenths of a percent. More may have resulted at the state and local level but there is no clear connection between the federal grants and such spending.
More generally I reported that on balance the federal policy responses to the crisis have not been effective. Three years after the crisis began the recovery is weak and unemployment is high. A direct examination of the fiscal stimulus packages shows that they had little effect and have left a harmful legacy of higher debt. The impact of the extraordinary monetary actions has been mixed: while some actions were helpful during the panic stage of the crisis, others brought the panic on in the first place and have had little or no impact since the panic. The monetary actions have also left a legacy of a large monetary overhang which must eventually be unwound.
I am frequently asked what I would have done differently. It turns out that I testified before the same Senate Budget Committee two years ago in November 2008 and recommended a specific four part fiscal policy response to the crisis. The response was based on certain established economic principles, which I summarized by saying that policy should be predictable, permanent and pervasive affecting incentives throughout the economy.
But this is not the policy we got. Rather than predictable, the policy has created uncertainty about the debt, growing federal spending, future tax rate increases, new regulations, and the exit from the unorthodox monetary policy. Rather than permanent, it has been temporary and thereby has not created a lasting economic recovery. And rather than pervasive, it has targeted certain sectors or groups such as automobiles, first time home buyers, large financial firms and not others. It is not surprising, therefore, that the policy response has left us with high unemployment and low growth. Given these facts, the best that one can say about the policy response is that things could have been even worse, a claim that I disagree with and see no evidence to support.
Saturday, September 18, 2010
Timely Views on Deflation from Governor Shirakawa
For years economists and policymakers in the United State have been expressing fears that America would enter a Japanese-style deflation and thereby experience a lost decade like Japan in the 1990s. One of the earliest examples was the October 1999 Woodstock Vermont conference (later published in the Journal of Money Credit and Banking) on how to avoid deflation, which may have been an impetus to the Fed’s decision to hold interest rates so low in the period from 2003-2005. In his recently published history of the Federal Reserve Volume 2, Allan Meltzer reports, based on conversations at the time, that “Chairman Alan Greenspan believed and said that the country faced risk of deflation” during this period. Concerns about deflation are clearly on the minds of members of the FOMC as they meet next week. 
It was therefore very helpful and quite refreshing that Bank of Japan Governor Masaaki Shirakawa’s chose to address this issue in a speech this week at the Bank of Japan, Uniqueness or Similarity? Japan’s Post-Bubble experience in Monetary Policy Studies. Hearing from a person in a top leadership position who can reflect on the experience of dealing with deflation is very useful right now. I heard the speech in person and can report that many in the audience (including me) were very positive about the interesting ideas, the clarity of the exposition, and the many helpful charts. The most discussed chart, reproduced here, suggested an eerie similarity between the United States and Japan.
Other interesting points in the speech were that the recent Japanese-style deflation has been remarkably mild compared to the Great Depression and that “Empirical studies on Japan mostly show that quantitative easing produced significant effects on stabilizing the financial system, while it had limited effects on stimulating economic activity and prices.”
Friday, September 17, 2010
Not a Repeat of the Great Intervention
I am writing from Tokyo where I have spent a few days at the Bank of Japan. This week marked the first exchange market intervention by the Bank of Japan since March 16, 2004, a day I remember well because it was the last day of a massive exchange market intervention by Japan amounting to $320 billion and now called the Great Intervention. As U.S. Treasury Under Secretary for International Affairs, I worked closely with the Japanese on the start and the exit from the Great Intervention.
Some have asked me to compare this week’s intervention with the start of that earlier intervention because the earlier one was closely related to the Bank of Japan’s quantitative easing, a subject which is back on the table. Indeed, some are speculating that the recent intervention might be the start of another large dose of quantitative easing, not only in Japan but elsewhere. Today’s Financial Times front page story, Monetary Easing Fears Lift Gold To Record High reports that “Traders said Tokyo’s intervention in the yen market, which injected fresh liquidity into the Japanese economy, was a sign that central banks were prepared to begin a new round of quantitative easing. Traders said the Federal Reserve could follow suit next week at its monthly interest rate setting meeting, and that gold would probably benefit from it.”
The U.S policy toward the Great Intervention by Japan was part of a strategy to support Japanese efforts to increase money growth to levels achieved before the start of their deflation. So it did relate to quantitative easing. By not registering objections to the intervention, the U.S. made it easier for Japan to increase money growth. The strategy worked this way: When the Bank of Japan intervenes and buys dollars in the currency markets at the instruction of the Finance Ministry, it pays for the dollars with yen. Unless the Bank of Japan offsets—sterilizes—this increase in yen by selling (rather than buying) other assets, such as Japanese government bonds, the Japanese money supply increases. In the past, U.S. Administrations had leaned heavily against the Japanese intervening in the markets to drive down the yen. By adopting a more tolerant position toward the intervention—especially if it went unsterilized—we could help to increase the money supply in Japan. So when Zembei Mizoguchi, the vice Minister at the Japan’s Ministry of Finance, discussed the possibility in late 2002 that currency intervention was going to increase, I did not object, as the U.S. Treasury usually does.
After a few months into 2003, the unprecedented nature of the intervention became clear to everyone. The Japanese would not publicly announce their daily interventions, but the markets began to sense it, and at the end of each month the Japanese would report on the monthly totals. I had arranged for the Japanese to email me personally whenever they intervened in the market, and to call me about very large interventions. When I read email on my Blackberry in the early morning I would frequently find messages from Tokyo like “small intervention during Tokyo trading hours; 1.2 billion dollars purchased,” and I was awakened by quite a few late night or very early morning calls from Tokyo too.
By the summer of 2003, the data began to show that the Japanese economy was finally turning the corner. Though it was too early to be sure about the recovery in Japan, it seemed to me that the Japanese could soon begin to exit from their unusual exchange rate policy of massive intervention. For the next few months we worked with the Japanese on an exit strategy. By early February 2004, the Japanese decided to complete the exit and Zembei called me to outline their exit strategy: They would intervene even more heavily in the next month and then stop. The idea seemed strange to me, but the Japanese had never tried to mislead me, so I knew that this was indeed their strategy.
Intervention did increase and it was not until March 5, 2004 that we really saw the beginning of the end of the intervention. At 8:30 that morning, Washington time, the U.S. Labor Department released their monthly employment report. Employment for the month of February was up by only 21,000 jobs, much less than we or the market had anticipated. News like this would normally have a negative impact on the dollar because weaker jobs data would lower the chances of an interest rate increase by the Fed, thereby making the dollar slightly less attractive to investors seeking higher interest rates. But the dollar did not weaken and on March 5 the Japanese had purchased $11.2 billion dollars that day which made the dollar appreciate rather than depreciate as one would expect. They were not simply smoothing the market, they were working against it. Zembei had told me that they were going to do more intervention before they did less, but this was simply excessive. He was working against market fundamentals. I called him over the weekend to complain that this type of intervention was completely unwarranted and I was as forceful as a friend and ally could be. Zembei acknowledged that they were still intervening heavily now, but the March 5 dollar buy was part of the exit plan. I argued that the exit period had gone on long enough.
Zembei did soon stop intervening, after another week of heavy dollar purchases, but nothing that equaled March 5. The last purchase of dollars occurred on March 16 when the Japanese bought “only” $615 million. On the 17th my Blackberry reported no intervention, and again on the 18th. There was no intervention for the rest of March and the rest of the 2004, and all the way through 2005 and now through September 14, 2010. The yen did not strengthen much in the months after the Great Intervention ended.
My assessment, based on this experience, is that the recent intervention is not, and should not, be a repeat of the Great Intervention. While that intervention was not sterilized and quantitative easing occurred, many at the Bank of Japan did not think it was so successful. Moreover, the need for more liquidity in the Japanese banking system is not so obvious now. And the protectionist pressures in the United States are greater now, especially with the very weak U.S. economy. Complaints in the U.S. congress about the recent intervention are already greater than what we heard during the Great Intervention at the time.
In any case, I hope this perspective on the Great Intervention from a U.S. Treasury official at the time is useful. It is drawn in part from my book Global Financial Warriors.
Thursday, September 16, 2010
Proven Economic Principles
Today’s Wall Street Journal article by George Shultz, Michael Boskin, John Cogan, Allan Meltzer and me shows that the financial crisis, recession, and continued high unemployment have been caused by government policies that have deviated from proven economic principles. The solution is to get back to those principles. How? The article describes the principles and outlines a five-part economic strategy to get back to them.
Sunday, September 12, 2010
Lehman Weekend
Two years ago, on Friday Sept 12, 2008, the Lehman Weekend began. Many people are still trying to figure out why the bailout of Lehman was aborted or what would have happened if there were a special bankruptcy chapter for such financial institutions. Books have been written about the Weekend including Sorkin’s Too Big To Fail and more will be written. The Dodd-Frank bill’s requirement for a Fed audit will reveal more. In my view one of the most informative writings is the Lehman Bankruptcy Examiner’s report, based on extensive interviews and examination of documents. The whole report is quite long (thousands of pages), so I thought it would be useful to prepare this excerpt which focuses only on the events of that weekend.
Saturday, September 11, 2010
Flying Back to Treasury on 9/11
I was in a hotel room in Tokyo when the first plane hit the World Trade Center. Recently sworn in as Under Secretary at Treasury, I was part of a delegation to Japan that included Paul O’Neill and many reporters, including Michael Phillips of the Wall Street Journal. We all watched the tragedy on television. I got very close—it seemed like inches—to the TV screen. When the first tower started collapsing I looked up from the screen to see faces of horror, disbelief, for some reason noticing, and now remembering, Michael Phillips’ look of utter shock. No one knew it then but Michael would later do five tours in Iraq imbedded with the Third Battalion, Seventh Marines and would write a moving book in 2005, The Gift of Valor, about a young Marine corporal, who sacrificed his life to save his fellow marines, a great American hero in what would come to be the global war on terror. The Marine, Jason Dunham, was awarded the Medal of Honor in 2006.
We immediately cancelled our meetings in Japan and by the next morning—still 9/11 in the United States—we were on a C-17 military jet flying back to America. The plane ride back from Japan was eerie. A C-17 is about as long as a DC-10, but when you’re inside it seems much bigger and more cavernous—an “echoing belly” is how General Tommy Franks described it—designed to hold tanks and other large military equipment. The only passenger seats are straight-backed canvas jump seats bolted along the metal wall of the fuselage. Unable to lie down or even slouch in those seats, some of us simply spread out on the cold bare metal deck when we wanted to sleep.
To get back faster we had an aerial refueling over Alaska. It took place at night, though at that latitude and elevation it seemed like perpetual twilight. The Air Force pilot invited me to watch the refueling from the cockpit, and it was amazing—the most impressive combination of advanced technology, hand-eye coordination, precision teamwork, and raw nerve that I had ever observed.
The rendezvous with the tanker jet had been arranged when the flight plan was put together in Japan. When we got close to the designated time and place, the pilots started looking for the tanker, which was to fly up from a base in Alaska. They first located the tanker plane on radar. Soon after that, they got visual contact. The co-pilot said to me, “See it, sir? It’s right out there.” But I couldn’t see a thing except stars and the twilight at the horizon.
Our plane was to approach the tanker from underneath, and as we got closer to the tanker the small speck the pilots could see grew until suddenly there was this huge jet plane only a few feet above us. Our pilot was using a specially-designed joy stick with a monitoring device consisting of rows of lights that turned red or green depending on whether our plane was coming up at the right position relative to the tanker. It reminded me a lot of a computer game, but this was for real. These two huge jets were zooming through the dark at something like 500 miles per hour, so it was amazing to me, though seemingly routine to those pilots, that the planes were close enough to each other that I could see the faces of the guys in the tanker as they lowered the fuel hose and somehow got it to go into the opening in our fuel tank. After a while the tank registered full and the hose was pulled back in, the tanker disappeared into the night, and we headed home across Canada. As we flew into the lower 48 there were no commercial flights to be seen. The plane’s radar screen was nearly blank.
That remarkable night time aerial refueling would mark a watershed for me and my responsibilities at Treasury. It was the beginning of a much closer cooperation and coordination with the Defense Department and with the U.S. military. It was also the start of many completely new experiences that I could never have expected when I signed up for a job in Treasury. I suppose I could have gotten a little spooked being in that cockpit but I felt very calm, kind of resigned to a new purpose where I would be forging new teams to handle new tasks, and I would be relying on the expertise and experience of others—people like these pilots—and they would be relying on mine. I slept well that night on the steel deck. Months later when I would fly on other military planes—C-130 transports in Afghanistan, Blackhawk helicopters in Iraq—I would always feel just as calm, even at the times when it looked like I was in harm’s way.
When I got back to Washington, the city was on alert. DC was a logical place for another attack, and the secret service was particularly concerned about security around the White House and the adjacent buildings which included the Treasury. We planned for the worst case scenarios. We made lists of essential jobs that would have to be done if the Treasury was wiped out—running the $30 billion Exchange Stabilization Fund in case we had to intervene in the currency markets was an example. We visited the remote locations that we would live in if the Treasury Building was destroyed, developed plans for continuity of operations and continuity of government, and reviewed the order of succession. We cancelled the annual meetings of the IMF and World Bank, which had been scheduled to be held in Washington on September 29th and 30th. Our intelligence experts expected large groups of protestors and a meeting with thousands of foreign financial officials, bankers, and press would have severely stretched the already overextended Washington security forces. And we had many other things to do.
Condensed from Global Financial Warriors
Thursday, September 9, 2010
Post-Crisis Changes in Principles of Economics Texts
Many have written about how the introductory economics textbook should change as a result of the crisis.
In November 2008, one year after the crisis started, I addressed this question in a practical way when Mike Worls—economics editor at South-Western Cengage, publisher of my principles text with Akila Weerapana—asked if we would write a new crisis edition of our book. We agreed, started work immediately, and published the first post-crisis principles of economics text in the summer of 2009, with such additions as the role of government in the crisis, quantitative easing, zero bound on interest rates, small impact of the 2008 fiscal stimulus, moral hazard, housing bubbles, etc.
Then, two years after the crisis, Alan Blinder addressed the question at the American Economic Association meetings last January explaining how he would change his textbook by, for example, giving more emphasis to short run Keynesian issues and adding in securitization.
Now, three years after the crisis, Paul Gregory addressed the question in a new thoughtful post on his blog. Paul’s piece benefits greatly from the additional evidence that the 2009 stimulus packages had little effect with unemployment still quite high three years after the crisis began. He takes a decidedly non-Keynesian approach, reinforcing his earlier textbook with Roy Ruffin.
Soon Akila and I will be doing another edition with the benefit of even more information, perhaps the first second-edition post-crisis principles of economics text.
Wednesday, September 8, 2010
More on Massive Quantitative Easing
In tomorrow’s Wall Street Journal there is a symposium on monetary policy in which Richard Fisher, Rick Mishkin, Vince Reinhart, Allan Meltzer, Ron McKinnon and I participate. One of the points I make in my piece is that another massive dose of quantitative easing is not appropriate now. I briefly explained the rationale for this point of view in a post on this blog several days ago, where I referred to Milton Friedman’s advocacy of stable monetary policy rules. A number of people wrote to ask me about that post, and Scott Sumner has written a thoughtful blog entry about it, quoting Milton Friedman on Japan.
I completely agree that the problems in Japan in the 1990s stemmed from a sharp decline in money growth compared with the 1980s, from 8.9 percent per year during 1980.1--1991.4 to 2.6 percent per year during 1992.1 – 2000.1 as shown in the Table and Chart in this speech I gave at the Bank of Japan. This decline in money growth was a discretionary action which Friedman, Allan Meltzer, and others rightly criticized. This criticism is quite consistent with Friedman’s view that we should avoid large discretionary changes in money growth and instead follow a constant money growth rule. To correct this mistake of a sharp decline in money growth, Friedman recommended that the Bank of Japan increase money growth but “without again overdoing it,” presumably taking money growth back to the more appropriate levels of the 1980s.
Now consider the current situation in the United States. We did not see the same kind of decline in money growth as in Japan going into the recent recession. The US recession began in December 2007. Measured over 12 month periods, M2 growth rose from 4.8% in January 2006 to 5.9% in January 2007 to 6.0% in January 2008 to 10.4% in January 09. Then, as a result of quantitative easing, which began in September 2008, the growth rate of the monetary base (using the same 12-month measure) increased from 2 percent to over 100 percent which helped increase the growth rate of M2 and other monetary aggregates. See chart. Now as the size of the Fed’s balance sheet did not keep growing at such a rapid pace, the growth rate of the monetary base (and M2) has declined. Another large dose of quantitative easing would again send the growth rate of money soaring, but then only to decline again as it has recently. So quantitative easing as practiced by the Fed has increased the volatility of money growth significantly.
Money growth volatility is something Milton Friedman was surely against. In his Newsweek column of December 1, 1980 entitled "The Fed Fails---Again” he wrote “The key problem has been the erratic swings [in money growth] from one extreme to the other that have produced uncertainty in the financial markets and instability in economic activity.” On top of all this, my research shows that the impact of quantitative easing on mortgage rates or other long term borrowing rates has been quite small and statistically insignificant.
I hope this additional information is helpful.
I completely agree that the problems in Japan in the 1990s stemmed from a sharp decline in money growth compared with the 1980s, from 8.9 percent per year during 1980.1--1991.4 to 2.6 percent per year during 1992.1 – 2000.1 as shown in the Table and Chart in this speech I gave at the Bank of Japan. This decline in money growth was a discretionary action which Friedman, Allan Meltzer, and others rightly criticized. This criticism is quite consistent with Friedman’s view that we should avoid large discretionary changes in money growth and instead follow a constant money growth rule. To correct this mistake of a sharp decline in money growth, Friedman recommended that the Bank of Japan increase money growth but “without again overdoing it,” presumably taking money growth back to the more appropriate levels of the 1980s.
Now consider the current situation in the United States. We did not see the same kind of decline in money growth as in Japan going into the recent recession. The US recession began in December 2007. Measured over 12 month periods, M2 growth rose from 4.8% in January 2006 to 5.9% in January 2007 to 6.0% in January 2008 to 10.4% in January 09. Then, as a result of quantitative easing, which began in September 2008, the growth rate of the monetary base (using the same 12-month measure) increased from 2 percent to over 100 percent which helped increase the growth rate of M2 and other monetary aggregates.
 See chart. Now as the size of the Fed’s balance sheet did not keep growing at such a rapid pace, the growth rate of the monetary base (and M2) has declined. Another large dose of quantitative easing would again send the growth rate of money soaring, but then only to decline again as it has recently. So quantitative easing as practiced by the Fed has increased the volatility of money growth significantly.
Money growth volatility is something Milton Friedman was surely against. In his Newsweek column of December 1, 1980 entitled "The Fed Fails---Again” he wrote “The key problem has been the erratic swings [in money growth] from one extreme to the other that have produced uncertainty in the financial markets and instability in economic activity.” On top of all this, my research shows that the impact of quantitative easing on mortgage rates or other long term borrowing rates has been quite small and statistically insignificant.
I hope this additional information is helpful.
Monday, September 6, 2010
Beyond GDP Measures Don’t Make the US Look Better
My colleagues Chad Jones and Pete Klenow have computed a new measure of economic welfare which combines consumption, leisure, mortality, and even inequality. Their new measure is closely correlated with GDP per capita as the attached diagram from their paper suggests. But there are differences. For example, income per capita in France is only 70 percent of that in the United States, while the new welfare measure for France is 97 percent of that in the United States. The difference is mainly due to more leisure and less income inequality in France. The gains and losses of utility from different levels of income inequality are based on the Rawls abstract concept of the veil of ignorance in which each person enters a lottery each year determining what country he or she will live in--one with less or more income inequality. Chad and Pete have a whole section on “caveats” in their interesting paper. 
Subscribe to:
Posts (Atom)