“Stock prices rose and long-term interest rates fell when investors began to anticipate the most recent action.”
How can one determine whether stock prices rose and long-term interest rates fell in anticipation of QE2? Obviously it is very difficult because many other things affect stock and bond markets, and one can never know for sure, but the data presented in the following charts raise serious doubts that such anticipation effects were either substantial or sustainable.
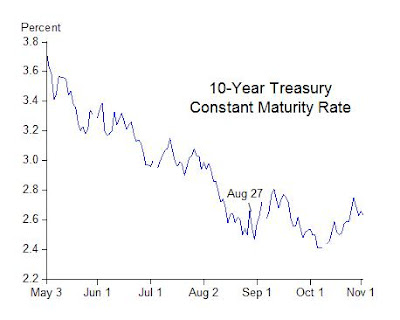
First consider long-term Treasury interest rates. The first chart shows the interest rate on benchmark 10-year Treasury bonds. Note that these long-term interest rates had been coming down since May—long before markets could reasonably have anticipated another large dose of quantitative easing. They have been relatively flat since August. But to assess more formally whether long-term interest rates fell “when investors began to anticipate” QE2, one must consider a date or dates on when such anticipations are likely to have begun.

One logical date is August 27, the day of Ben Bernanke’s Jackson Hole speech where he discussed the framework of quantitative easing in detail. Indeed, this Jackson Hole speech is frequently mentioned in the financial press. The date of the speech is shown in the chart. The long-term rate was 2.66 percent on that date. If anticipations of quantitative easing lowered long-term interest rates, then one would expect this rate to have been lower on November 2, the day before the FOMC’s recent action. But this is not what happened. The interest rate was the same 2.66 percent on November 2 as it was on August 27.
What about other long-term interest rates? The second chart shows the interest rates on Moody’s Aaa and Baa corporate bonds. On November 2 the Moody’s Baa corporate rate was 5.71 percent compared with 5.62 percent on August 27. And on November 2 the Aaa rate was 4.66 percent compared with 4.41 percent on August 27. In both cases rates were higher, rather than lower, compared with what rates were on the day investors could plausibly have begun to anticipate the recent action. Next consider stock prices. The third chart shows the S&P 500 index over the same period. Observe that the current rally began in early July as shown in the chart. Evidently concerns about a double dip recession had diminished by early July and earnings reports began improving. From July 2 to August 10 the S&P 500 rallied by 10 percent. That rally was temporarily interrupted starting on August 10, but then continued. From August 10 to November 2 the S&P 500 rose another 7 percent.

Any assessment of the impact of anticipations of QE2 on stock prices depends crucially on how one interprets this rally and the interruption around August 10. It is important to note that August 10 was the day of the FOMC meeting where the Fed first indicated it would reinvest the maturing mortgage backed securities into the Treasury market, so this first hint of quantitative easing had a negative impact on stock prices. This was also the meeting where the Fed appeared to be very downbeat about the economy and revealed considerable dissention among FOMC members about how policy decisions would be made going forward. Jon Hilsenrath later wrote about this meeting in detail in the Wall Street Journal calling it "among the most contentious in Ben Bernanke's four and a half year tenure as central bank chairman." Hence, the large negative impact on stock prices is understandable.
Ben Bernanke’s August 27 Jackson Hole speech was helpful in this regard because it undid the damage of the August 10 meeting, as I argued at the time, by presenting a transparent framework for making decisions and conveying the image of a more functional FOMC than portrayed, for example, in Hilsenrath’s article. So in my view, the consistent story is that the August stock market dip was Fed-induced and its reversal was also Fed-induced. In contrast an explanation based on anticipations of quantitative easing is inconsistent because stock prices went one way on August 10 and another way on August 27.
In any case these interest rate and stock price data raise doubts about the narrative that long-term interest rates fell and stock prices rose in anticipation of QE2. As with all the other stimulus programs tried in recent years, it is important to get the narrative right, and more empirical work is welcome.
No comments:
Post a Comment