The first one relates to fiscal policy. It shows the ups and downs of real GDP growth in the 1930s and the contributions to that growth coming directly from government purchases and other components of GDP. (The data come from this interactive table at the Bureau of Economic Analysis ). Clearly the change in government purchases contributed little to the downturn in 1937 and 1938. Even with generous multiplier effects on consumption, the changes in government purchases are too small to make much difference. Given that any decline in government purchases now due to the end of the 2009 stimulus is even smaller than the declines in 1937, the fading out of the stimulus is unlikely to have much to do with the current slowdown.

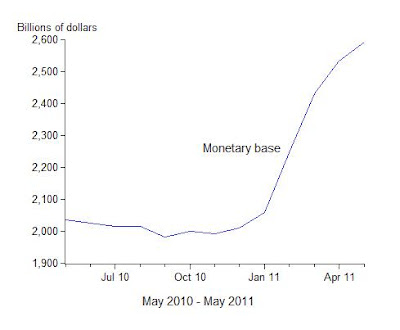
The other two charts relate to monetary policy. One shows the large decline in the monetary base (currency plus reserves) from May 1936 to May 1937 and the other shows the large increase in the monetary base from May 2010 to May 2011. While the decline in the monetary base is likely to have been a reason for the slowdown in the 1930s, there is no such decline now to explain the current slowdown. The recent ups and downs in the monetary base are due to the quantitative easings and at some point the monetary base will have to decline again. The challenge for the Fed will be to carry out this exit strategy in a clear and transparent manner in order to minimize disruption and uncertainty.


No comments:
Post a Comment