- Predictions made in early 2009 about whether the stimulus package would work varied widely because the models used to make the predictions varied widely. Models used by Christy Romer and Jared Bernstein predicted large effects of the 2009 stimulus (ARRA), while models used by John Cogan, Tobias Cwik, Volker Wieland and me predicted small effects.
- Now that ARRA is winding down people are asking which prediction was right. Did ARRA stimulate the economy significantly or not? To answer this question the same models are again being used, but now to evaluate the policy. CBO, for example, takes this approach in their congressionally mandated impact studies of ARRA.
- But you learn virtually nothing about whether a stimulus package worked using this approach because the models simply repeat the same prediction story over again.
- Unfortunately, the complexity of models with a hundred or more equations makes it difficult to see this point, so I created an illustration with stylized one-equation models which people seem to like. A little algebra is needed.
- Consider two models relating the size of the stimulus package (symbolized by S) to GDP (symbolized by Y). Model A is Y= αS + Z and Model B is Y = Z, where Z is an unobservable shock and α is a coefficient which we set to 1.5.
- Suppose that a stimulus is enacted with S = 2, but Y falls to -1. Then the shock implied by Model A is Z = - 4 while the shock implied by model B is Z= -1.
- Now consider policy evaluation of the stimulus based on a counterfactual where there is no stimulus so S=0.
- Economists using Model A would say:
Just as we predicted, the stimulus package worked. Without it, Y would have fallen to -4 rather than -1. The decline in output would have been 4 times as deep, a Great Depression 2.0. - Economists using Model B would simply say:
Just as we predicted the stimulus package didn’t work. - The best way to way to deal with this problem is to look empirically at the direct effect of the stimulus using actual data, but without imposing a specific model structure like Model A or Model B. In a paper forthcoming in the Journal of Economic Literature I use this direct approach and find that the ARRA did not stimulate the economy.
Thursday, June 30, 2011
How to Resolve the Stimulus Debate: Use Data Not the Same Models Over Again
Friday, June 24, 2011
Unchanged Debt Explosion
CBO’s Long-Term Budget Outlook released this week is essentially the same as last year’s: without a change in policy the debt will explode to over 900 percent of GDP. One difference is that CBO decided not to print out the debt ratio in their spread sheet “Data Underlying Scenarios and Figures” as in the past two year once the ratio went beyond 200 percent. So in the following graph I computed the ratio from the revenues and spending projections.  This means that the backdrop used two years ago by the "best Economics 1 lecturer ever" still applies, though the quest lecturer is now 2 years old and we still haven’t fixed the problem.
This is why it is so important to adopt reforms like the ones proposed this week by Congressman Kevin Brady, which would hold down federal spending as a share of GDP and stop the debt explosion. By using potential GDP rather than actual GDP his proposal would eliminate the pro-cyclical spending implied by many other spending cap proposals (which use actual GDP) where federal spending would rise rapidly during booms and fall rapidly during recessions.
Today I touched on the importance of getting spending ratios down and returning to sound fiscal (and monetary) policy in this “Big Interview' with Kelly Evans at the Wall Street Journal
This means that the backdrop used two years ago by the "best Economics 1 lecturer ever" still applies, though the quest lecturer is now 2 years old and we still haven’t fixed the problem.This is why it is so important to adopt reforms like the ones proposed this week by Congressman Kevin Brady, which would hold down federal spending as a share of GDP and stop the debt explosion. By using potential GDP rather than actual GDP his proposal would eliminate the pro-cyclical spending implied by many other spending cap proposals (which use actual GDP) where federal spending would rise rapidly during booms and fall rapidly during recessions.
Today I touched on the importance of getting spending ratios down and returning to sound fiscal (and monetary) policy in this “Big Interview' with Kelly Evans at the Wall Street Journal
Tuesday, June 21, 2011
The Two Year Anniversary of the Non-Recovery
This month marks the two-year anniversary of the end of recession and start of recovery. But it’s a recovery in name only, so weak as to be nonexistent. And it has been weak from the start. Real GDP growth has averaged only 2.8 percent per year compared with 7 percent after last deep recession in 1981-82, as shown in the following chart. And the unemployment rate is still over 9 percent.
 Today the Joint Economic Committee of the Congress held a hearing on whether a credible plan to reduce government spending growth would bolster or hinder the recovery. I argued that a credible budget strategy would strengthen the recovery, by removing the threats of another fiscal crisis, higher taxes, higher inflation and higher interest rates—all caused by the huge deficits and growing debt and all impediments to private investment and job creation (written testimony here and opening remarks at C-Span 6:23 minutes here). To balance the budget without increasing taxes the plan would have to reduce spending growth by $6 trillion over ten years.
Fortunately, there are some signs of progress: The election last November sent a message to Washington to reduce the deficit and the debt; the 2011 budget deal reduced 2010-2011 growth in discretionary budget authority from +$39B to -$39B; President Obama withdrew his first budget proposal for 2012 and is agreeing to less spending; and the idea of tying the debt limit hike to reductions in spending growth is holding, despite protests from the Treasury Secretary and the Fed Chairman.
One way to implement a credible budget strategy in our current divided government would be to agree now to reduce spending by $2.5 trillion over ten years (including material changes in 2012) as part of the $2.5 trillion debt limit hike, and then debate how to deal with the remaining $3.5 trillion gap in the presidential election. One side would say to close the gap by raising taxes. The other side would say to close the gap by reducing spending. While the outcome would still be uncertain, there would be far less uncertainty about the budget than currently exists.
Today the Joint Economic Committee of the Congress held a hearing on whether a credible plan to reduce government spending growth would bolster or hinder the recovery. I argued that a credible budget strategy would strengthen the recovery, by removing the threats of another fiscal crisis, higher taxes, higher inflation and higher interest rates—all caused by the huge deficits and growing debt and all impediments to private investment and job creation (written testimony here and opening remarks at C-Span 6:23 minutes here). To balance the budget without increasing taxes the plan would have to reduce spending growth by $6 trillion over ten years.Fortunately, there are some signs of progress: The election last November sent a message to Washington to reduce the deficit and the debt; the 2011 budget deal reduced 2010-2011 growth in discretionary budget authority from +$39B to -$39B; President Obama withdrew his first budget proposal for 2012 and is agreeing to less spending; and the idea of tying the debt limit hike to reductions in spending growth is holding, despite protests from the Treasury Secretary and the Fed Chairman.
One way to implement a credible budget strategy in our current divided government would be to agree now to reduce spending by $2.5 trillion over ten years (including material changes in 2012) as part of the $2.5 trillion debt limit hike, and then debate how to deal with the remaining $3.5 trillion gap in the presidential election. One side would say to close the gap by raising taxes. The other side would say to close the gap by reducing spending. While the outcome would still be uncertain, there would be far less uncertainty about the budget than currently exists.
Thursday, June 16, 2011
Why Avoiding Bailouts is Good Policy
Asgeir Jonsson’s interesting and perceptive article in today’s Wall Street Journal provides a clear lesson for students and policymakers alike about the harm that comes from bailouts and the good that comes from avoiding them. If a government recognizes the reality of a solvency problem early, and deals with it, its citizens will end up much better off than if it wishfully thinks it’s a liquidity problem and takes bailouts. Iceland recognized its problem early and took action, while Ireland thought wishfully and took bailouts, and that’s made all the difference.
It was a lesson learned by many emerging market countries about a decade ago, and it has made a big difference for them too. That's one reason why an emerging market leader would make a good IMF leader today. More on that later.
It was a lesson learned by many emerging market countries about a decade ago, and it has made a big difference for them too. That's one reason why an emerging market leader would make a good IMF leader today. More on that later.
Saturday, June 11, 2011
Why Not Go For 5% Growth?
Some skeptics have complained about the 5% national economic growth target put forth by former Minnesota Governor Tim Pawlenty in his speech this week about his economic plan. They say it can’t be done. But I think the goal makes a great deal of sense. It would focus policymakers like a laser beam on the great benefits that come from higher growth and on the pro-growth policies needed to achieve it. As with any goal, if you take it seriously, you’ll choose policies that work toward that goal and reject those that don’t.
As stated in the speech, “5% growth is not some pie-in-the-sky number.” One way to see why is by dissecting the number into its two parts using basic economics. As we teach in Economics 1, economic growth equals employment growth plus productivity growth. Productivity is the amount of goods and services that workers produce on average in a given period of time. Thus, higher economic growth can come from higher employment growth or from higher productivity growth. Now consider some examples of average growth rates over the next ten years.
First, look at employment growth. Given the dismal jobs situation, that’s the highest priority. Currently the percentage of the working-age population (age 16 and over) that is actually working is very low at 58.4 percent. In the year 2000 it reached 64.7 percent, so that is at least a feasible number. Raising the employment-to-population ratio to 64.7 means an employment increase of 10.8 percent (64.7-58.4/58.4 = .108) or about 1 percent per year over 10 years, even without any growth of the population. Adding in about 1 percent for population growth (from Census projections), gives employment growth of 2 percent per year.
Now consider productivity growth. Since the productivity resurgence began around 1996, productivity growth in the United States has averaged 2.7 percent according to the Bureau of Labor Statistics. So numbers in that range are not pie in the sky. As Harvard economist Dale Jorgenson and his colleagues have shown, the IT revolution is part of the explanation for the productivity growth, and, if not stifled, is likely to continue, as is pretty clear to me as I sit a few hundred yards from Facebook and other high-tech firms.
Now if we add the 2.7 percent productivity growth to the 2 percent employment growth, we get 4.7 percent economic growth, which is within reaching distance of—or simply rounds up to—the 5 percent target set by Governor Pawlenty. Thus, five percent growth is a good goal to aspire to, whereas 3 or 4 percent would be too little and 6 or 7 percent too much. Of course, one can fine-tune these calculations--for example, by estimating changes in hours per worker or the difference between nonfarm business (which BLS productivity numbers refer to) and total GDP--or raise questions about demographic effects on the employment-to-population ratio. And one could use different examples, perhaps lower employment growth and higher productivity growth, but the basic point about the goal would be the same.
You can see how the types of pro-growth policies in the Pawlenty plan would work toward the goal by reducing spending growth enough to balance the budget without tax increases and thereby remove threats of a debt crisis; by lowering marginal tax rates to spur hiring and job growth; by scaling back unnecessary new regulations which impede private investment and higher productivity, and by restoring sound monetary policy to remove uncertainty about inflation or another financial crisis.
Thursday, June 9, 2011
Comparing 2011 with 1937
In today’s article in Bloomberg View I explore reasons for the current weak recovery, and in particular whether there is an analogy with what happened in the recession of 1937-38 which interrupted the recovery from the Great Depression. Several charts elaborate on numbers provided there which argue against such an analogy.
The first one relates to fiscal policy. It shows the ups and downs of real GDP growth in the 1930s and the contributions to that growth coming directly from government purchases and other components of GDP. (The data come from this interactive table at the Bureau of Economic Analysis ). Clearly the change in government purchases contributed little to the downturn in 1937 and 1938. Even with generous multiplier effects on consumption, the changes in government purchases are too small to make much difference. Given that any decline in government purchases now due to the end of the 2009 stimulus is even smaller than the declines in 1937, the fading out of the stimulus is unlikely to have much to do with the current slowdown.

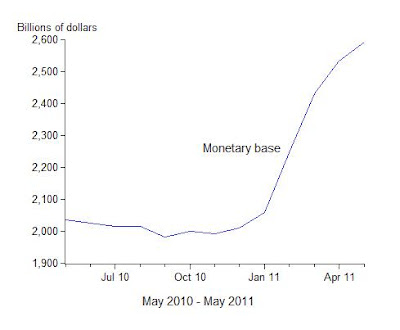
The other two charts relate to monetary policy. One shows the large decline in the monetary base (currency plus reserves) from May 1936 to May 1937 and the other shows the large increase in the monetary base from May 2010 to May 2011. While the decline in the monetary base is likely to have been a reason for the slowdown in the 1930s, there is no such decline now to explain the current slowdown. The recent ups and downs in the monetary base are due to the quantitative easings and at some point the monetary base will have to decline again. The challenge for the Fed will be to carry out this exit strategy in a clear and transparent manner in order to minimize disruption and uncertainty.
The first one relates to fiscal policy. It shows the ups and downs of real GDP growth in the 1930s and the contributions to that growth coming directly from government purchases and other components of GDP. (The data come from this interactive table at the Bureau of Economic Analysis ). Clearly the change in government purchases contributed little to the downturn in 1937 and 1938. Even with generous multiplier effects on consumption, the changes in government purchases are too small to make much difference. Given that any decline in government purchases now due to the end of the 2009 stimulus is even smaller than the declines in 1937, the fading out of the stimulus is unlikely to have much to do with the current slowdown.
The other two charts relate to monetary policy. One shows the large decline in the monetary base (currency plus reserves) from May 1936 to May 1937 and the other shows the large increase in the monetary base from May 2010 to May 2011. While the decline in the monetary base is likely to have been a reason for the slowdown in the 1930s, there is no such decline now to explain the current slowdown. The recent ups and downs in the monetary base are due to the quantitative easings and at some point the monetary base will have to decline again. The challenge for the Fed will be to carry out this exit strategy in a clear and transparent manner in order to minimize disruption and uncertainty.
Monday, June 6, 2011
Lessons From the Financial Crisis For Teaching Economics
Last week at Stanford the American Economic Association hosted its first conference ever on teaching economics. It was a great success and a second conference will be held in Boston next year, sponsored by the Journal of Economic Education (JEE).
I was asked to speak at the conference about the impact of the financial crisis on teaching economics. Here are the slides from the talk, which will eventually be published in the JEE. I emphasized that one’s view of how economics teaching should change depends greatly on one’s view of the crisis. For example, Alan Blinder and I have different views of the crisis and the policy response, so naturally we have different views about how the crisis should affect teaching.
In my view the problem was that economic policy deviated from basic economic principles which had worked well. The result was a great recession, a financial panic, and now a very weak, nearly nonexistent, recovery. The deviations included a monetary policy which set interest rates too low for too long and a regulatory policy which failed to enforce existing rules. The deviations from sound principles continued when government responded with an ad hoc bailout process and temporary fiscal stimulus programs. The good news for the economy is that economic growth and stability can be restored by adopting policies consistent with basic economic principles.
The good news for teaching is that the crisis has left us with many examples where teachers can illustrate basic economic principles including that incentives matter, the permanent income hypothesis, regulatory capture, and the money multiplier. Moreover, the heated disagreement among economists about the crisis presents another opportunity to make the subject more interesting to students.
Thursday, June 2, 2011
Economic and Political Leadership on the Budget
The Wall Street Journal’s headline for my article today In Praise of Debt Limit ‘Chicken’ nicely conveys the idea that linking a hike in the debt to a cut in spending—which pundits call a game of chicken—is not a game at all. It’s good economic policy. Economists in Washington should show some leadership and try to implement that policy.
But political leadership is needed too, and from the White House not just from the House of Representatives. Here President Obama could take a page from historian David Kennedy’s Freedom From Fear (page 138 to be exact) which describes how none other than FDR, in March 1933, showed political leadership and trimmed the largest entitlement of the day. As I explain in this short piece from today’s Bloomberg View's Echoes, the entitlement in question amounted to 25 percent of the budget, a much larger percentage than Social Security today.
But political leadership is needed too, and from the White House not just from the House of Representatives. Here President Obama could take a page from historian David Kennedy’s Freedom From Fear (page 138 to be exact) which describes how none other than FDR, in March 1933, showed political leadership and trimmed the largest entitlement of the day. As I explain in this short piece from today’s Bloomberg View's Echoes, the entitlement in question amounted to 25 percent of the budget, a much larger percentage than Social Security today.
Subscribe to:
Posts (Atom)